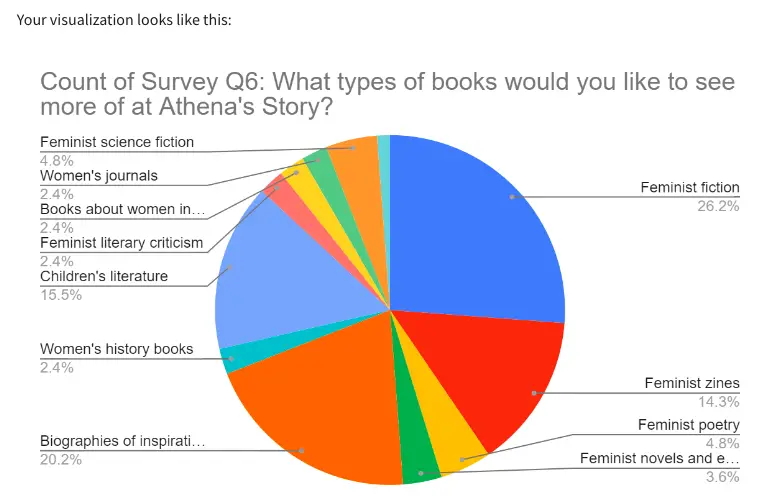
Ask Questions to Make Data-Driven Decisions Course Challenge Answers (Part 1: Q1–10)

Looking for ‘ask questions to make data driven decisions course challenge answers‘?

In this post, I provide accurate answers and detailed explanations for Module 4: *Course challenge* of Course 2: Ask Questions to Make Data-Driven Decisions Google Data Analytics Professional Certificate.

Whether you’re preparing for quizzes or brushing up on your knowledge, these insights will help you master the concepts effectively. Let’s dive into the correct answers and detailed explanations for each question.

Here, we’ll walk through questions 1 to 10 with detailed explanations to support your learning.

To find answers to the remaining questions, check out the full module breakdown below:

1. Scenario 1, questions 1-5

You’ve just started a job as a data analyst at a small software company that provides data analytics and business intelligence solutions. Your supervisor asks you to kick off a project with a new client, Athena’s Story, a feminist bookstore. They have four existing locations, and the fifth shop has just opened in your community.

Athena’s Story wants to produce a campaign to generate excitement for an upcoming celebration and introduce the bookstore to the community. They share some data with your team to help make the event as successful as possible.

Your task is to review the assignment and the available data, then present your approach to your supervisor. Click the link below to access the email from your supervisor:

Then, review the email, and the Customer Survey and Historical Sales datasets.

To use the templates for the datasets, click the links below and select “Use Template.”

Links to templates: Customer Survey and Historical Sales

OR

If you don't have a Google account, you can download the CSV files directly from the attachments below.

After reading the email, you notice that the acronym WHM appears in multiple places. You look it up online, and the most common result is web host manager. That doesn’t seem right to you, as it doesn’t fit the context of a feminist bookstore. How do you proceed?

  • Send your supervisor a polite, concise email, asking them to confirm the meaning of WHM.
  • Schedule a meeting with your supervisor, the client, and another analyst on your team to figure out the meaning.
  • Call the client to ask what WHM means and inform them that using acronyms is not a professional business practice.
  • Proceed with the project assuming WHM must mean web host manager.

2. Scenario 1 continued

Now that you know WHM stands for Women’s History Month, you review the Customer Survey dataset which contains both qualitative and quantitative data.

To use the template for the dataset, click the link below and select “Use Template.”

Link to template: Customer Survey

OR

If you don't have a Google account, you can download the CSV file directly from the attachment below.

The data in column F (Survey Q6: What types of books would you like to see more of at Athena's Story?) is quantitative.

  • True
  • False

Explanation:
Qualitative data consists of non-numerical responses, such as text describing customer preferences, as in Survey Q6.

3. Scenario 1 continued

Next, you review the customer feedback in column F of the Customer Survey dataset.

To use the template for the dataset, click the link below and select “Use Template.”

Link to template: Customer Survey

OR

If you don't have a Google account, you can download the CSV file directly from the attachment below.

The attribute of column F is, “Survey Q6: What types of books would you like to see more of at Athena's Story?” In order to verify that children’s literature and feminist zines are among the most popular genres, you create a visualization. This will help you clearly identify which genres are most likely to sell well during the Women’s History Month campaign.

The chart you create demonstrates the percentages of each book genre that make up the whole. It’s called an area chart.

  • True
  • False

Explanation:
The chart described shows percentages of each genre making up the whole, which is characteristic of a pie chart, not an area chart.

  • Pie Chart: Best for showing part-to-whole relationships (percentages).
  • Area Chart: Shows changes over time and is based on trends or stacked values.

4. Now that you’ve confirmed that children’s literature and feminist zines are among the most requested book genres, you review the Historical Sales dataset.

To use the template for the dataset, click the link below and select “Use Template.”

Link to template: Historical Sales

If you don't have a Google account, you can download the CSV file directly from the attachment below.

You’re pleased to see that the dataset contains data that’s specific to children’s literature and feminist zines. This will provide you with the information you need to make data-inspired decisions. In addition, the children’s literature and feminist zines metrics will help you organize and analyze the data about each genre in order to determine if they’re likely to be profitable.

Next, you calculate the total sales over 52 weeks for feminist zines. You type =CALCULATE(E2-E53) but get an error. What is the correct syntax?

  • =SUM(E2:E53)
  • =MAX(E2:E53)
  • =COUNT(E2:E53)
  • =CALC(E2:E53)

Explanation:
The SUM() function in Excel/Sheets adds up a range of numbers.

  • CALCULATE() is not a valid Excel/Sheets function.
  • MAX() returns the highest number.
  • COUNT() counts how many cells contain numbers—not their sum.
  • CALC() does not exist.

5. Scenario 1 continued

After familiarizing yourself with the project and available data, you present your approach to your supervisor. You provide a scope of work, which includes important details, a schedule, and information on how you plan to prepare and validate the data. You also share some of your initial results and the pie chart you created.

In addition, you identify the problem type, or domain, for the data analysis project. You decide that the historical sales data can be used to provide insights into the types of books that will sell best during Women’s History Month this coming year. This will also enable you to determine if Athena’s Story should begin selling more children’s literature and feminist zines.

Using historical data to make informed decisions about how things may be in the future is an example of which problem domain?

  • Making predictions
  • Identifying themes
  • Spotting something unusual
  • Discovering connections

Explanation:
Using historical data to forecast future trends involves predictive analytics, a key component of problem-solving in data analysis.

6. Scenario 2, questions 6-10

You’ve completed this program and are now interviewing for your first junior data analyst position. You’re hoping to be hired by an event planning company, Patel Events Plus. Access the job description below:

So far, you’ve successfully completed the first round of interviews with the human resources manager and director of data and strategy. Now, the vice president of data and strategy wants to learn more about your approach to managing projects and clients. Access the email you receive from the human resources director below:

You arrive Thursday at 1:45 PM for your 2 PM interview. Soon, you’re taken into the office of Mila Aronowicz, vice president of data and strategy. After welcoming you, she begins the behavioral interview.

First, she hands you a copy of Patel Events Plus’s organizational chart. Access the chart below:

As you’ve learned in this course, stakeholders are people who invest time, interest, and resources into the projects you’ll be working on as a data analyst. Let’s say you’re working on a project involving data and strategy. Based on what you find in the organizational chart, if you need information from the secondary stakeholders, who can you ask? Select all that apply.

  • Chief executive officer
  • Data analytics coordinator
  • Project manager, analytics
  • Vice president, data and strategy

Explanation:
Primary stakeholders usually include executives and direct clients. Secondary stakeholders are involved in support roles—like team members, coordinators, or managers.

  • CEO is likely a primary stakeholder.
  • Others are secondary but still important to consult during the project.

7. Scenario 2 continued

Next, the vice president wants to understand your knowledge about asking effective questions. Consider and respond to the following question. Select all that apply.

Let’s say we just completed a big event for a client and wanted to find out if they were satisfied with their experience. Provide some examples of measurable questions that you could include in the customer feedback survey.

  • How would you rate your overall experience — poor, average, above average, or excellent?
  • Was this your first time using Patel Events Plus to plan your event? Yes or no?
  • Did you experience any problems with your event? Yes or no?
  • Why did our event options and features create a successful event?

Explanation:

  • Allows responses on a quantifiable scale for measurable analysis.
  • A simple Yes/No question is easy to measure.
  • A Yes/No format provides clear, measurable data.

8. Now, the vice president presents a situation having to do with resolving challenges and meeting stakeholder expectations. Consider and respond to the following question. Select all that apply.

You’re working with a dataset that the data analytics coordinator should have cleaned, but it turns out that it wasn’t. Your supervisor thought the dataset was ready for use, but you discover nulls, redundant data, and other issues. The project is due in less than two weeks. Which of the following options would be an appropriate approach?

  • Email your supervisor and the data analytics coordinator to communicate about the issue. Ask if you can meet to come up with a solution.
  • Proceed with the project using the available data. You don’t want to get the associate data analyst in trouble, and you don’t want to miss your deadline.
  • Email the data analytics coordinator to ask if the two of you can work together to clean the data, as the project is on a tight timeline.
  • Provide your supervisor with a proposed revised timeline. Politely explain that you need some additional time to clean the data.

Explanation:

  • Communicating the problem ensures transparency and collective problem-solving.
  • Demonstrates initiative and accountability by addressing potential delays.
  • Effective teamwork ensures data cleaning is completed efficiently.

9. Scenario 2 continued

Your next interview question deals with sharing information with stakeholders. Consider and respond to the following question. Select all that apply.

Let’s say you’ve designed a dashboard to give stakeholders easy, automatic access to data about an upcoming event. Describe the benefits of using a dashboard.

  • Dashboards offer live monitoring of incoming data.
  • Dashboards present pre-cleaned, historical data.
  • Dashboards enable stakeholders to interact with the data.
  • Dashboards are easy to design and understand.

10. Scenario 2 continued

Your final behavioral interview question involves using metrics to answer business questions. Your interviewer hands you a copy of the Patel Events dataset.

To use the template for the dataset, click the link below and select “Use Template.”

Link to template: Patel Events Data

OR

If you don't have a Google account, you can download the CSV file directly from the attachment below.

Then, she asks: Recently, Patel Events Plus purchased a new venue for our events. If we asked you to compare the purchase price (cost) and net profit, what would you be calculating?

  • Return on investment
  • Occupancy rate
  • Sales numbers
  • Metric goal

Explanation:
Static reports are better suited for summarizing historical data rather than real-time insights.

That’s it for Part 1! Continue your learning journey with the next set of answers.

Next Part: Ask Questions to Make Data-Driven Decisions Course Challenge Answers (Part 2: Q11–20)

Leave a Reply