
Ask Questions to Make Data-Driven Decisions Course Challenge Answers (Part 3: Q21–26)
This is Part 3 of the Module 4 quiz answers for “Ask Questions to Make Data-Driven Decisions Course Challenge” from the Google Data Analytics Professional Certificate on Coursera.
Here, we’ll walk through questions 21 to 26 with detailed explanations to support your learning.
To find answers to the remaining questions, check out the full module breakdown below:
21. Scenario 2 continued
Next, the vice president wants to understand your knowledge about asking effective questions. Consider and respond to the following question. Select all that apply.
Let’s say we just completed a big event for a client and wanted to find out if they were satisfied with their experience. Provide some examples of measurable questions that you could include in the customer feedback survey.
- How satisfied were you with our event planning service — dissatisfied, neutral, or satisfied?
- What problems did you experience with our events team?
- What did you most love about your event experience?
- On a scale from 1 to 5, with 1 being not at all likely and 5 being very likely, how likely are you to recommend Patel Events Plus?
Explanation:
These questions provide quantitative insights that can be tracked, compared, and analyzed.
The other options are qualitative, focusing on narrative responses rather than measurable data.
22. Now that you’ve confirmed that children’s literature and feminist zines are among the most requested book genres, you review the Historical Sales dataset.
To use the template for the dataset, click the link below and select “Use Template.”
Link to template:
Historical Sales
.
OR
If you don't have a Google account, you can download the CSV file directly from the attachment below.
You’re pleased to see that the dataset contains data that’s specific to children’s literature and feminist zines. This will provide you with the information you need to make data-inspired decisions. In addition, the children’s literature and feminist zines metrics will help you organize and analyze the data about each genre in order to determine if they’re likely to be profitable.
Next, you calculate the total sales over 52 weeks for children’s literature. What is the correct syntax?
- =SUM(D2:D53)

- =CALCULATE(D2:D53)
- =MAX(D2:D53)
- =COUNT(D2:D53)
Explanation:
The SUM function adds all numeric values in the specified range, calculating the total sales.
23. Scenario 2, questions 6-10
You’ve completed this program and are now interviewing for your first junior data analyst position. You’re hoping to be hired by an event planning company, Patel Events Plus. Access the job description below:
So far, you’ve successfully completed the first round of interviews with the human resources manager and director of data and strategy. Now, the vice president of data and strategy wants to learn more about your approach to managing projects and clients. Access the email you receive from the human resources director below:
You arrive Thursday at 1:45 PM for your 2 PM interview. Soon, you’re taken into the office of Mila Aronowicz, vice president of data and strategy. After welcoming you, she begins the behavioral interview.
First, she hands you a copy of Patel Events Plus’s organizational chart. Access the chart below:
As you’ve learned in this course, stakeholders are people who invest time, interest, and resources into the projects you’ll be working on as a data analyst. Let’s say you’re working on a project involving data and strategy.
Based on what you find in the organizational chart, if you need information from the primary stakeholder, who can you ask?
- Director, strategy
- Project manager, analytics
- Vice president, data and strategy
- Chief executive officer
Explanation:
The primary stakeholder is typically the one with the most influence, interest, and decision-making power in the project. Since this is a data and strategy project, the VP of Data and Strategy is the primary stakeholder.
24. Scenario 1 continued
Next, you review the customer feedback in column F of the Customer Survey dataset.
To use the template for the dataset, click the link below and select “Use Template.”
Link to template:
Customer Survey
OR
If you don't have a Google account, you can download the CSV file directly from the attachment below.
The attribute of column F is, “Survey Q6: What types of books would you like to see more of at Athena's Story?” In order to verify that children’s literature and feminist zines are among the most popular genres, you create a visualization. This will help you clearly identify which genres are most likely to sell well during the Women’s History Month campaign.
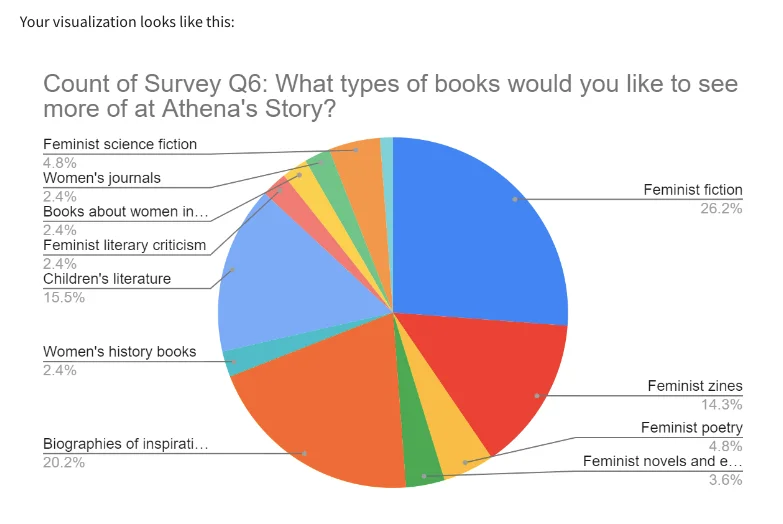
What is a pie chart effective for demonstrating?
- Percentages that make up a whole

- Relationships between variables
- Where things are located on a map
- Trends over time
Explanation:
Pie charts are ideal for visualizing proportions of a dataset as parts of a whole.
25. Scenario 2 continued
Your next interview question deals with sharing information with stakeholders. Consider and respond to the following question. Select all that apply.
Let’s say you’ve created a report to present stakeholders with information about an upcoming event. Describe the benefits of using a report.
- Reports provide a snapshot of high-level, historical data.
- Reports reflect data that’s already been cleaned and sorted.
- Reports enable stakeholders to interact with the data.
- Reports offer live monitoring of incoming data.
Explanation:
Reports are static, summarized documents that present cleaned, organized, and analyzed data—perfect for stakeholders who want insight without digging through raw data.
26. Scenario 2 continued
Your final behavioral interview question involves using metrics to answer business questions. Your interviewer hands you a copy of the Patel Events dataset.
To use the template for the dataset, click the link below and select “Use Template.”
Link to template:
Patel Events Data
OR
If you don't have a Google account, you can download the CSV file directly from the attachment below.
Then, she asks: Recently, Patel Events Plus purchased a new venue for our events. If we asked you to calculate the return on investment of this purchase, which metrics would you use? Select all that apply.
- 2019 events held at new venue (column D)
- Purchase price (column C)
- Net profit in 2019 (column F)
- Purchase date
Explanation:
To calculate ROI (Return on Investment), the basic formula is: ROI = (Net Profit / Cost of Investment) × 100
So:
- Net profit in 2019 = Return (i.e., how much you earned)
- Purchase price = Investment (i.e., how much you spent)
Congratulations! You’ve completed all 65 questions. Share this post if it helped you, and check out other Coursera quiz answers below.
Related contents:
Module 1: Ask effective questions
Module 2: Make data-driven decisions
Module 3: Spreadsheet magic
Module 4: Always remember the stakeholder
You might also like:
Course 1: Foundations: Data, Data, Everywhere
Course 3: Prepare Data for Exploration
Course 4: Process Data from Dirty to Clean
Course 5: Analyze Data to Answer Questions
Course 6: Share Data Through the Art of Visualization
Course 7: Data Analysis with R Programming
Course 8: Google Data Analytics Capstone: Complete a Case Study