
Module 4: Course challenge
Looking for ‘Share data through the art of visualization course challenge answers’?
In this post, I provide accurate answers and detailed explanations for Module 4: Course challenge of Course 6: Share Data Through the Art of Visualization – Google Data Analytics Professional Certificate.
Whether you’re preparing for quizzes or brushing up on your knowledge, these insights will help you master the concepts effectively. Let’s dive into the correct answers and detailed explanations for each question.
1. Scenario 1, questions 1-9
You have been working as a junior data analyst at Bowling Green Business Intelligence for nearly a year. Your supervisor, Kate, tells you that she believes you are ready for more responsibility. She asks you to lead an upcoming client presentation. You will be responsible for creating the data story, identifying the right tools to use, building the slideshow, and delivering the presentation to stakeholders.
Your client is Gaea, an automotive manufacturer that makes eco-friendly electric cars. For the past year, you have been working with the data team in Gaea’s Bowling Green, Kentucky, headquarters. For the presentation, you will engage the data team, as well as its regional sales representatives and distributors. Your presentation will inform their business strategy for the next three-to-five years.
You begin by getting together with your team to discuss the data story you want to tell. You know the first step in data storytelling is to engage your audience.
Fill in the blank: A big part of engagement is knowing how to eliminate less important details. So, you use spotlighting to _____ the data in order to identify the most important insights.
- recheck
- scan
- study
- research
2. Scenario 1, continued
After you identify the most important insights, it’s time to create your primary message. Your team’s analysis has revealed three key insights:
Electric vehicle sales demand is expected to grow by more than 400% by 2025.
The number of publicly available vehicle charging stations is a significant factor in consumer buying decisions. Currently, there are many locations with so few charging stations that electric car owners would run out of power when traveling between stations.
Vehicle battery range is also a significant factor for consumers. In 2020, the average battery range was 210 miles. However, the vast majority of survey respondents report they will not buy an electric car until the battery range is at least 300 miles per charge.
Based on these insights, you create your primary message. Which of the following reflect the expectations of a primary message?
- The number of publicly available vehicle charging stations is a significant factor in consumer buying decisions. Therefore, Gaea must begin building vehicle charging stations
- Although electric vehicle sales demand is on the rise, low availability of charging stations and short battery range are significant hurdles that Gaea must overcome ✅
- Electric vehicle sales demand is expected to grow by more than 400% by 2025. However, the number of publicly available vehicle charging stations is a significant factor in consumer buying decisions. Currently, there are many locations with so few charging stations that electric car owners would run out of power when traveling between stations. Vehicle battery range is also a significant factor for consumers. In 2020, the average battery range was 210 miles. However, the vast majority of people say they will not buy an electric car until the battery range is at least 300 miles per charge
- Electric vehicle demand is skyrocketing
3. Scenario 1, continued
Next, you decide on your data narrative’s characters, setting, plot, big reveal, and aha moment. During the narrative, you want to communicate to your stakeholders about the challenges associated with the current lack of vehicle charging stations and why it's important for Gaea to increase its cars’ battery range by 2025.
Information about charging stations and the need to increase battery range will be part of the setting of your data story.
- True
- False
4. Scenario 1, continued
Now, it’s time to consider which tools to use to create data visualizations that will clearly communicate the results of your analysis. You and your team decide to make both spreadsheet charts and Tableau data visualizations. In addition, you want to provide them with a tool that will achieve the following goals:
Organize multiple datasets about electric vehicle battery ranges into a central location
Enable tracking and analysis of electric vehicle data
Simplify data visualizations about the number of available charging stations using maps of the different geographies
What tool do you create for your stakeholders?
- Dashboard
- Spreadsheet
- Database
- Algorithm
5. Now that you have finished planning the data story with your team, it’s time to create data visualizations. First, you consider electric vehicle sales worldwide in 2015 compared to 2020. You use a spreadsheet to create the following bar graph to compare the two values:
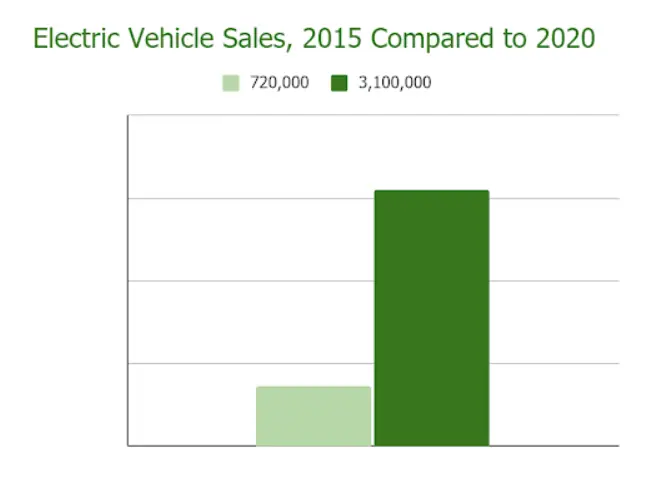
You want to add a label to represent the scale (total count by year) of electric vehicle sales. Where on the graph do you label these values?
- The colors
- The vertical bars
- The y-axis
- The x-axis
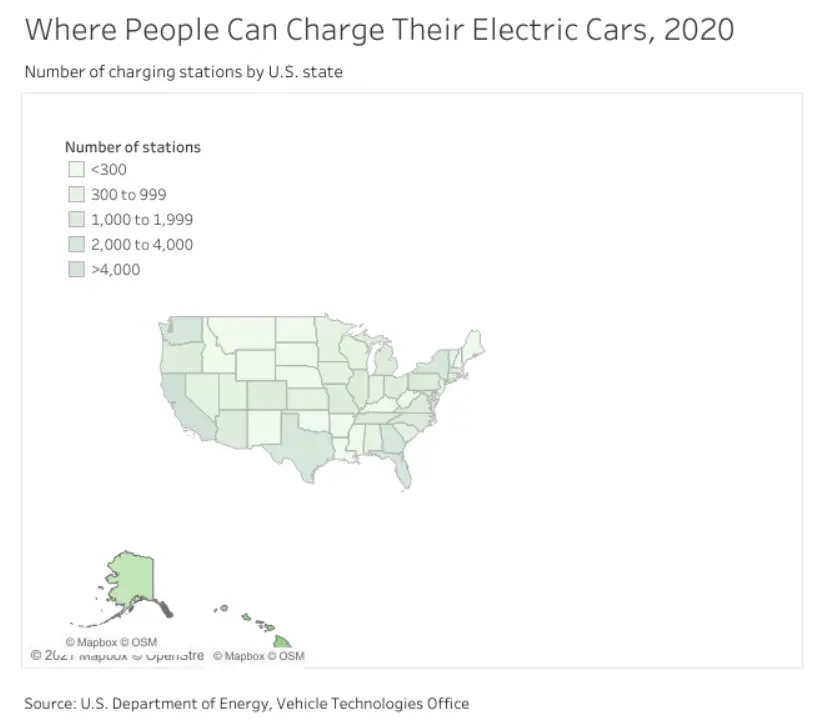
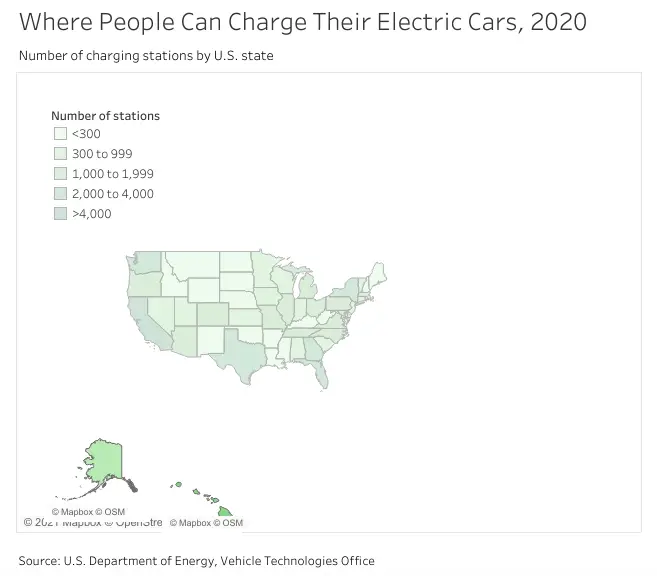
6. Next, you explore how access to public car-charging stations is influencing electric vehicle purchases. As your analysis has revealed, there are many areas without enough places for people to plug in and charge their cars. This lack of charging stations has a negative impact on demand for electric cars and overall vehicle sales.
You use Tableau to create the following draft of a visualization, which organizes the charging station data geographically:
After reviewing your draft, you realize that it could be improved.
Fill in the blank: To improve your draft, you select more varied hues and make the color intensity stronger. In addition, you choose darker _____ in order to reflect more light.
- views
- values
- visuals
- variables
7. Scenario 1, continued
Now, you want to highlight what your team’s analysis discovered about the number of charging stations available compared to the number of cars purchased. Your data has confirmed that the lack of charging stations causes the effect of fewer car sales. To communicate this effectively, you will need to convey causation to the stakeholders.
You explain that causation is the measure of the degree to which two variables move in relationship to each other. In the case of Gaea’s business, charging station numbers and car sales move in the same direction.
- True
- False
8. Scenario 1, continued
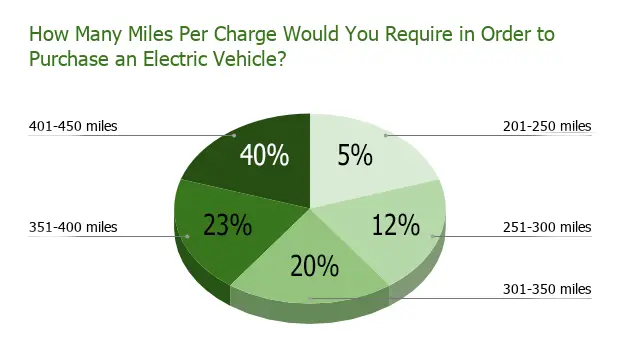
Once you finish creating data visualizations about the current state of the electric vehicle market, you turn to projections for the future. You want to communicate to stakeholders about the importance of longer vehicle battery range to consumers.
Your team’s data includes feedback from a consumer survey that investigated the importance of longer battery when choosing whether to purchase an electric car. The current average battery range is about 210 miles. By 2025, that distance is expected to grow to 450 miles per charge.
You create the following pie chart:
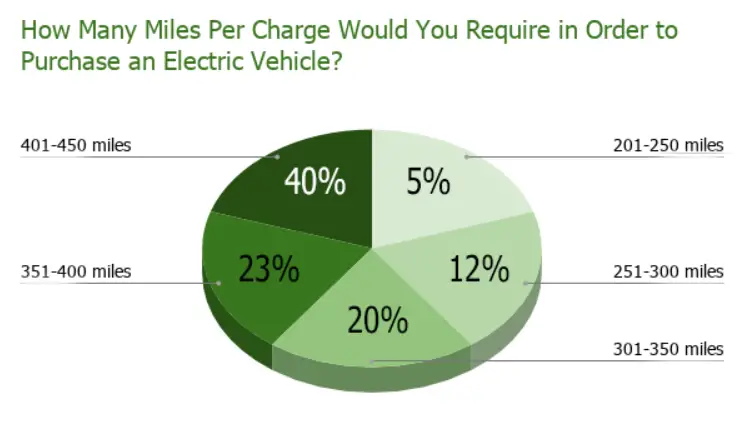
Fill in the blank: After reviewing your pie chart, you realize that it could be improved. You resize the _____ so they visually show the different values.
- labels
- axes
- segments
- values
9. Scenario 1, continued
It’s time to build your Tableau dashboard for stakeholders. You consider what type of layout to use.
You decide that you want to be able to adjust the height of the views and the data visualizations about electric vehicle sales, charging stations, and battery range. Which type of layout will enable you to do that?
- Vertical layout
- Circular layout
- Diagonal layout
- Horizontal layout
10. Scenario 2, questions 10-15
You have created your narrative and visuals, so now it’s time to build a professional and appealing slideshow. You choose a theme that matches the tone of your presentation. Then, you create a title slide with a title, subtitle, and the date.
Next, you create the following slide that compares electric vehicle sales in 2015 and 2020:
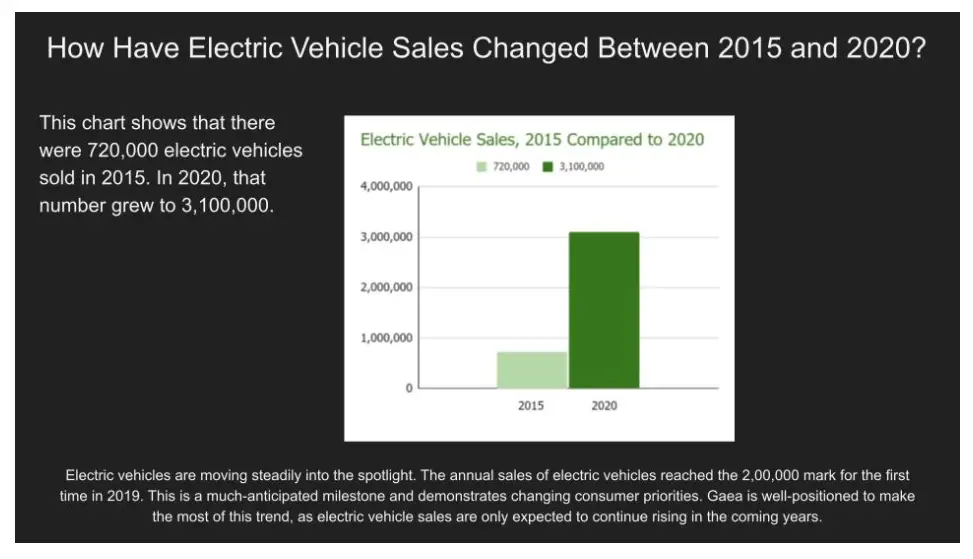
After reviewing your slide, you realize that it could be improved. What steps do you take to make the two text boxes beneath the header more effective? Select all that apply.Add Your Heading Text Here
- Edit the text to fewer than five lines total
- Ensure the text does not simply repeat the words you plan to say
- Use abbreviations to reduce the amount of text
- Edit the text to fewer than 25 words total
11. Scenario 2, continued
You then create the following slide to demonstrate the challenges associated with battery range and charging stations:
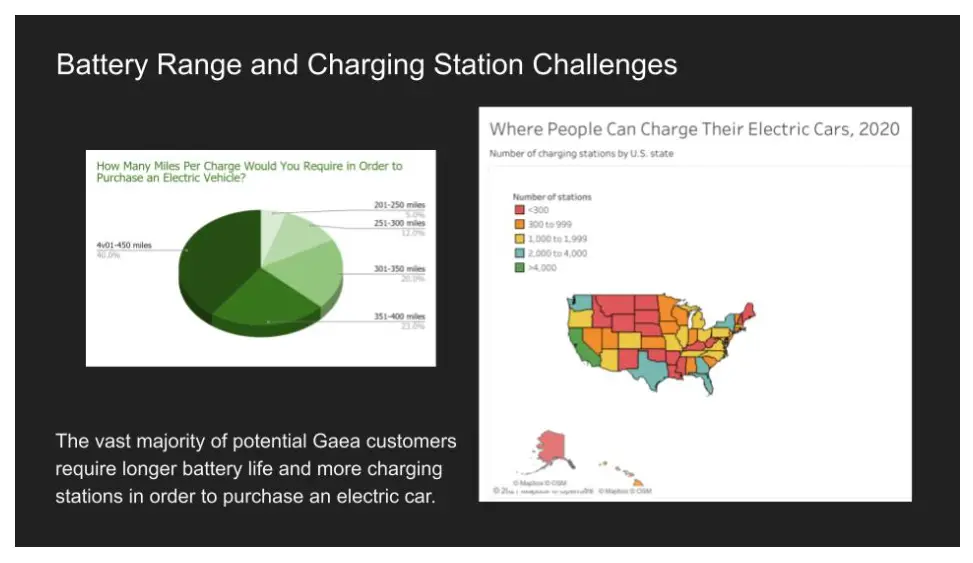
After reviewing your slide, you realize that the visual elements could be improved. A good solution would be for you to choose one data visualization to share on this slide, then create another slide for the second data visualization.
- True
- False
12. Scenario 2, continued
You complete your slideshow and share it with your team. Once it is approved by your supervisor, you begin preparing to give your presentation. You consider maintaining good posture, being aware of nervous habits, and making eye contact. In addition, you think about how you will explain the data visualizations.
One of the strategies you practice is the five-second rule. What are some key aspects of this rule? Select all that apply.
- Ask your audience if they understand the data visualization
- Be prepared to explain the data visualization
- Tell your audience the conclusion that you want them to understand
- Take no more than five seconds to explain the data visualization
13. Scenario 2, continued
Next, you prepare for the question-and-answer session that will follow your presentation. To predict what questions they may ask, you do a colleague test of your presentation. You should choose a colleague who has deep expertise in the electric vehicle industry.
- True
- False
14. Scenario 2, continued
Now that you have some idea of the questions the stakeholders will ask, you and a team member consider different objections that might arise.
Your team member asks you how you will respond if someone from Gaea questions your data-cleaning process. How do you prepare for this objection? Select all that apply.
- Keep a detailed log of your data-cleaning process
- Practice answering questions about your data-cleaning process
- Add your data-cleaning log to the slideshow appendix
- Be prepared to explain why data cleaning is not relevant at this stage of the project
15. Scenario 2, continued
The big day has arrived, and you have just finished giving your presentation to the Gaea team. It’s now time for the question-and-answer session, and a stakeholder asks you a very detailed question about one specific electric vehicle charging station initiative.
You listen to the whole question, then repeat it. For what reasons is this important? Select all that apply.
- It ensures the entire audience has heard the question, in case they did not when it was originally asked
- It enables you to rephrase it in a way that is easier to answer
- It helps you confirm that you understand the question
- It gives the stakeholder a chance to correct you if you misunderstand
16. Scenario 1, questions 1-9
You have been working as a junior data analyst at Bowling Green Business Intelligence for nearly a year. Your supervisor, Kate, tells you that she believes you are ready for more responsibility. She asks you to lead an upcoming client presentation. You will be responsible for creating the data story, identifying the right tools to use, building the slideshow, and delivering the presentation to stakeholders.
Your client is Gaea, an automotive manufacturer that makes eco-friendly electric cars. For the past year, you have been working with the data team in Gaea’s Bowling Green, Kentucky, headquarters. For the presentation, you will engage the data team, as well as its regional sales representatives and distributors. Your presentation will inform their business strategy for the next three-to-five years.
You begin by getting together with your team to discuss the data story you want to tell. You know the first step in data storytelling is to engage your audience.
You use spotlighting to help you identify the most important insights. Which of the following activities are involved with spotlighting? Select all that apply.
- Determining the data’s partiality
- Identifying connections or patterns
- Finding ideas or concepts that keep arising
- Noticing repeated words or numbers
17. Scenario 1, continued
Once you have identified the most important insights, it’s time to create your primary message. Your team’s analysis has revealed three key insights:
Electric vehicle sales demand is expected to grow by more than 400% by 2025.
The number of publicly available vehicle charging stations is a significant factor in consumer buying decisions. Currently, there are many locations with so few charging stations that electric car owners would run out of power when traveling between stations.
Vehicle battery range is also a significant factor for consumers. In 2020, the average battery range was 210 miles. However, the vast majority of survey respondents report they will not buy an electric car until the battery range is at least 300 miles per charge.
Based on these insights, you create your primary message. What are the expectations of a primary message? Select all that apply.
- Clear
- Direct
- Comprehensive
- Subtle
18. Scenario 1, continued
Next, you decide on your data narrative’s characters, setting, plot, big reveal, and aha moment. During the narrative, you want to communicate to your stakeholders about the challenges associated with the current lack of vehicle charging stations and why it's important for Gaea to increase its cars’ battery range by 2025.
In which part of your data narrative would you include information about charging stations, the need to increase battery range, and why it’s important for Gaea to increase its cars’ battery range?
- Aha moment
- Setting
- Plot
- Big reveal
19. Scenario 1, continued
It’s time to build your Tableau dashboard for stakeholders. You consider what type of layout to use.
Describe the differences between vertical and horizontal layouts. Select all that apply.
- Vertical layouts prevent items from being layered over other objects
- Vertical layouts adjust the height of the views and objects contained
- Horizontal layouts adjust the width of the views and objects contained
- Horizontal layouts prevent items from being layered over other objects
20. Scenario 2, questions 10-15
You have created your narrative and visuals, so now it’s time to build a professional and appealing slideshow. You choose a theme that matches the tone of your presentation. Then, you create a title slide with a title, subtitle, and the date.
Next, you create the following slide to communicate information about electric vehicle sales in 2015 compared to 2020:
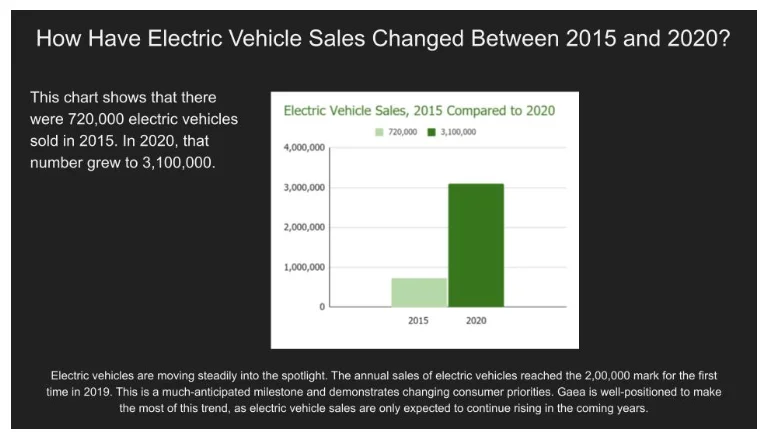
Alt-text: Slideshow with bar chart of electric vehicle sales from 2015 and 2022. 2022 had higher sales. There are also multiple sentences at the bottom of the slide and another piece of descriptive text near the chart.
To improve the slide, you remove the text box at the bottom. For what reasons will this make your slide more effective? Select all that apply.
- Slide text should be fewer than 25 words total
- The text shouldn’t simply repeat the words you say
- The font size is too small for your audience to read
- Slide text should be no more than 10 lines total
21. Scenario 2, continued
You complete your slideshow and share it with your team. Once it is approved by your supervisor, you begin preparing to give your presentation. You consider maintaining good posture, being aware of nervous habits, and making eye contact. In addition, you think about how you will speak.
What strategies can help you speak effectively? Select all that apply.
- Building in intentional pauses to give your audience time to think about what you have just said
- Speaking quickly so you are sure to have time to include all important data points
- Using short words and sentences
- Keeping the pitch of your sentences level so that your statements are not confused for questions
22. Scenario 2, continued
Next, you prepare for the question-and-answer session that will follow your presentation. What methods help you consider any limitations of your data? Select all that apply.
- Understand the strengths and weaknesses of the tools
- Eliminate the outliers
- Look at the context
- Critically analyze the correlations
23. Scenario 2, continued
The big day has arrived, and you finish your presentation to the Gaea team. In the question-and-answer session, a stakeholder asks you a very detailed question about a car battery range project that's still in development.
What strategies do you use in order to respond effectively? Select all that apply.
- Be certain that you understand the context of the question that the stakeholder is asking
- Involve the whole audience when you respond to the stakeholder
- Keep your response short and to the point, then add detail if there are follow-up questions
- Give yourself extra time by planning your thoughtful response when the stakeholder begins speaking
24. Scenario 1, continued
Your team’s analysis has revealed three key insights:
Electric vehicle sales demand is expected to grow by more than 400% by 2025.
The number of publicly available vehicle charging stations is a significant factor in consumer buying decisions. Currently, there are many locations with so few charging stations that electric car owners would run out of power when traveling between stations.
Vehicle battery range is also a significant factor for consumers. In 2020, the average battery range was 210 miles. However, the vast majority of survey respondents report they will not buy an electric car until the battery range is at least 300 miles per charge.
Fill in the blank: Based on these insights, you create a clear and direct _____, which will guide your data story.
- business case
- spotlight
- primary message
- specific question
25. Scenario 1, continued
Now, it’s time to consider which tools to use to create data visualizations that will clearly communicate the results of your analysis. You and your team decide to make both spreadsheet charts and Tableau data visualizations. In addition, you agree to build a dashboard to share live, incoming data with your stakeholders. This will help them achieve the following goals:
Organize multiple datasets about electric vehicle battery ranges into a central location
Enable tracking and analysis of electric vehicle data
Simplify data visualizations about the number of available charging stations using maps of the different geographies
Another key benefit of dashboards is that they enable you to maintain control of your data narrative.
- True
- False
26. Next, you explore how access to public car-charging stations is influencing electric vehicle purchases. As your analysis has revealed, there are many areas without enough places for people to plug in and charge their cars. This lack of charging stations has a negative impact on demand for electric cars and overall vehicle sales.
You use Tableau to create the following draft of a visualization, which organizes the charging station data geographically:
After reviewing your draft, you realize that it could be improved. What steps do you take to make your map more effective? Select all that apply.
- Select more varied hues
- Add more space between each state
- Make the intensity of the colors stronger
- Choose darker values
27. Scenario 1, continued
Now, you want to highlight what your team’s analysis discovered about the number of charging stations available compared to the number of cars purchased. Your data has confirmed that the lack of charging stations causes the effect of fewer car sales. To communicate this effectively, you will need to convey causation to the stakeholders.
How do you explain causation?
- Causation involves how often data values fall into certain ranges. In the case of Gaea’s business, data about the number of charging stations will fall into ranges associated with car sales.
- Causation is the measure of the degree to which two variables move in relationship to each other. In the case of Gaea’s business, charging station numbers and car sales move in the same direction.
- Causation involves everything associated with an event. In the case of Gaea’s business, the lack of charging stations has a negative effect on the entire automotive marketplace.
- Causation is when an action directly leads to an outcome, such as a cause-effect relationship. In the case of Gaea’s business, the lack of charging stations directly leads to the outcome of fewer car sales.
28. Scenario 2, continued
You then create the following slide to demonstrate the challenges associated with battery range and charging stations:
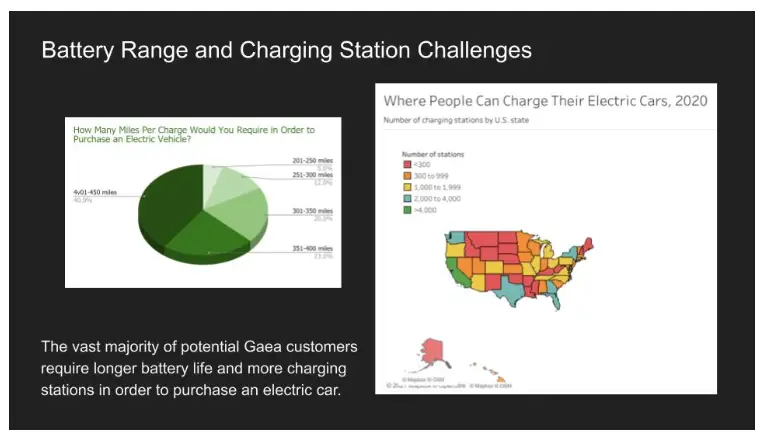
After reviewing your slide, you realize that the visual elements could be improved. You do this by first choosing one data visualization to share on this slide, then create another slide for the second data visualization.
Fill in the blank: In addition, you make sure to use _____ font sizes and colors for all of your data visualization titles.
- consistent
- unique
- colorful
- different
29. Scenario 2, continued
Now that you have some idea of the questions the stakeholders will ask, you consider potential objections. You and a team member consider different objections that might arise. Your team member asks you how you will respond if someone from Gaea has an objection that you haven’t prepared for.
You say that you will respond professionally using the information you currently have available in order to move quickly past the objection.
- True
- False
30. Scenario 1, questions 1-9
You have been working as a junior data analyst at Bowling Green Business Intelligence for nearly a year. Your supervisor, Kate, tells you that she believes you are ready for more responsibility. She asks you to lead an upcoming client presentation. You will be responsible for creating the data story, identifying the right tools to use, building the slideshow, and delivering the presentation to stakeholders.
Your client is Gaea, an automotive manufacturer that makes eco-friendly electric cars. For the past year, you have been working with the data team in Gaea’s Bowling Green, Kentucky, headquarters. For the presentation, you will engage the data team, as well as its regional sales representatives and distributors. Your presentation will inform their business strategy for the next three-to-five years.
You begin by getting together with your team to discuss the data story you want to tell. You know the first step in data storytelling is to engage your audience.
A big part of audience engagement is knowing how to eliminate less important details. What practice do you use to scan quickly through the data in order to identify the most important insights?
- Balancing
- Ranking
- Filtering
- Spotlighting
31. Scenario 1, continued
Now that you have finished planning the data story with your team, it’s time to create data visualizations. First, you consider electric vehicle sales worldwide in 2015 compared to 2020. You use a spreadsheet to create the following bar graph to compare the two values:

You add information on the x-axis to represent a scale of values for the total electric vehicle sales and on the y-axis to represent the time periods (2015 and 2020).
- False
- True
32. Scenario 2, continued
You then create the following slide to demonstrate the challenges associated with battery range and charging stations:
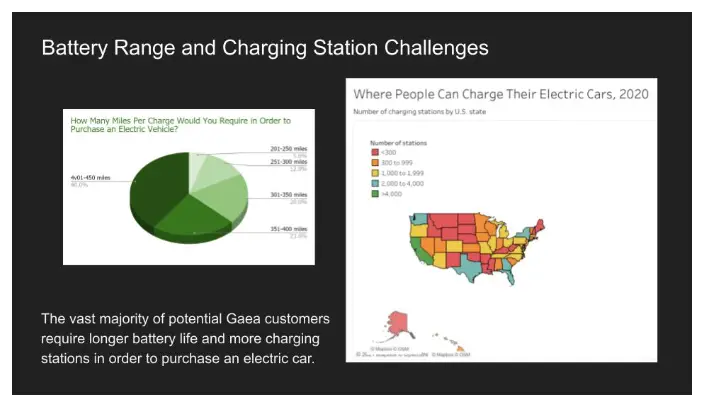
After reviewing your slide, you realize that the visual elements could be improved. Which of the following options would help you make the visual elements on this slide more effective? Select all that apply.
- Use more colors in the map
- Provide a detailed written explanation of both data visualizations
- Choose one data visualization to share on this slide, then create another slide for the second data visualization
- Use a consistent font size and color for data visualization titles
33. Scenario 2, continued
You complete your slideshow and share it with your team. Once it is approved by your supervisor, you prepare to give your presentation. You consider presentation best practices: maintaining good posture, being aware of nervous habits, and making eye contact. In addition, you think about how you will present your data visualizations.
What strategies can help you explain the data visualizations effectively? Select all that apply.
- Channel your excitement
- Start with the broader ideas
- Use the five-second rule
- Speak quickly to save time and cover all important data points
34. Scenario 1, continued
Scenario 1, continued
Next, you explore how access to public car-charging stations is influencing electric vehicle purchases. As your analysis has revealed, there are many areas without enough places for people to plug in and charge their cars. This lack of charging stations has a negative impact on demand for electric cars and overall vehicle sales.
You use Tableau to create the following draft of a visualization, which organizes the charging station data geographically:
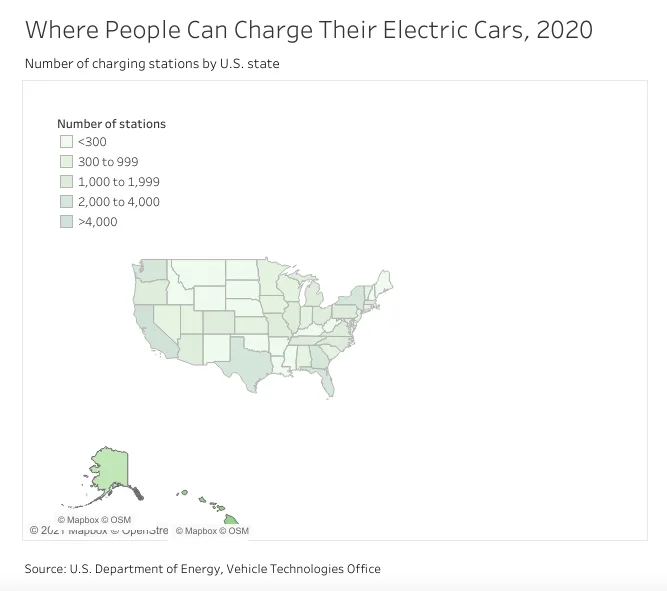
After reviewing your draft, you realize that it could be improved. To improve your draft, you select more varied hues, choose darker values, and make the color intensity stronger. This will also help clarify the spacing between the states.
- True
- False
35. Scenario 1, continued
Now, you want to highlight what your team’s analysis discovered about the number of charging stations available compared to the number of cars purchased. Your data has confirmed that the lack of charging stations causes the effect of fewer car sales. To communicate this effectively, you will need to convey causation to the stakeholders.
Fill in the blank: You explain that causation is when an action _____ an outcome. In the case of Gaea’s business, causation can be used to discuss the relationship between lack of charging stations and fewer car sales.
- changes the timing of
- directly leads to
- moves in relationship to
- prevents occurrence of
36. Scenario 1, continued
After creating data visualizations about the current state of the electric vehicle market, you turn to projections. You want to communicate to stakeholders about the importance of longer vehicle battery range to consumers.
Your team analyzes data from a consumer survey that investigated the importance of longer battery range when choosing whether to purchase an electric car. The current average battery range is about 210 miles. By 2025, that distance is expected to grow to 450 miles per charge.
You create the following pie chart:
After reviewing your pie chart, you realize that it could be improved. How do you make this chart more effective?
- Remove the labels for the number of miles per charge consumers will require before purchasing an electric vehicle
- Write a longer title to add more detail about the data the pie chart contains
- Add an x-axis and y-axis to provide additional explanation about the data
- Resize the pie segments so they visually show the different values
37. Scenario 2, continued
Next, you prepare for the question-and-answer session that will follow your presentation. What methods help you predict what questions your audience may ask? Select all that apply.
- Make sure you have a clear understanding of Gaea stakeholder objectives
- Do a test-run, or colleague test, of your presentation
- Be prepared to consider and describe any limitations of your data
- Add automotive jargon to your presentation to demonstrate that you understand these industry terms.
38. Scenario 2, continued
Now that you have some idea of the questions the stakeholders may ask, you consider potential objections. How do you ensure you are prepared for any potential objections? Select all that apply.
- Keep a detailed log of your data-cleaning process
- Be sure to include numerous perspectives during the analysis process
- Assure stakeholders that your analysis process is private so it cannot be reproduced by others
- Include information on where the data came from in an appendix
39. Scenario 1, continued
Next, you decide on your data narrative’s characters, setting, plot, big reveal, and aha moment. The characters are the people affected by your story. This includes your stakeholders, Gaea’s customers, and Gaea’s potential future customers. For the setting, you describe the current situation, potential tasks, and background information about the analysis project.
As you begin to work on the plot for the data narrative, which of the following ideas would you include? Select all that apply.
- How your data analysis can help Gaea solve its business problems
- The challenges associated with the current lack of vehicle charging stations
- A list of your recommendations and details about why they will help Gaea be successful
- Why it’s important for Gaea to increase its cars’ battery range by 2025
40. Scenario 1, continued
Next, you decide on your data narrative’s characters, setting, plot, big reveal, and aha moment. During the narrative, you want to communicate to your stakeholders about the challenges associated with the current lack of vehicle charging stations and why it's important for Gaea to increase its cars’ battery range by 2025.
The setting of your data story will include information about charging stations, the need to increase battery range, and why it’s important for Gaea to increase its cars’ battery range.
- True
- False
41. Scenario 1, continued
Once you finish creating data visualizations about the current state of the electric vehicle market, you turn to projections for the future. You want to communicate to stakeholders about the importance of longer vehicle battery range to consumers.
Your team’s data includes feedback from a consumer survey that investigated the importance of longer battery when choosing whether to purchase an electric car. The current average battery range is about 210 miles. By 2025, that range is expected to grow to 450 miles per charge.
You create the following pie chart:
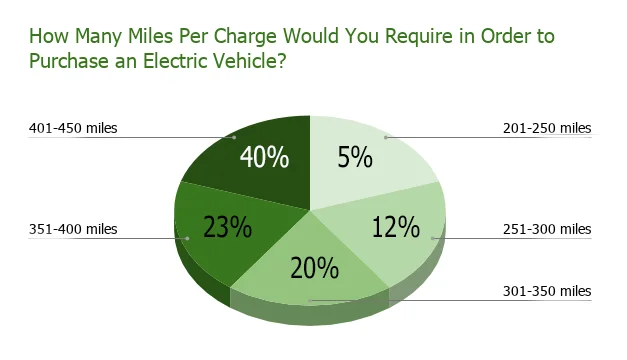
After reviewing your pie chart, you realize that it could be improved by resizing the segments. Resizing the segments in proportion to each segment's relative value enables you to visually show the different values.
- True
- False
Related contents:
Module 1: Visualize data
Module 2: Create data visualizations with Tableau
Module 3: Craft data stories
Module 4: Develop presentations and slideshows
You might also like:
Course 1: Foundations: Data, Data, Everywhere
Course 2: Ask Questions to Make Data-Driven Decisions
Course 3: Prepare Data for Exploration
Course 4: Process Data from Dirty to Clean
Course 5: Analyze Data to Answer Questions
Course 7: Data Analysis with R Programming
Course 8: Google Data Analytics Capstone: Complete a Case Study