
Module 5: Course challenge
Looking for ‘data analysis with r programming course challenge answers’?
In this post, I provide accurate answers and detailed explanations for Module 5: Course challenge of Course 7: Data Analysis with R Programming – Google Data Analytics Professional Certificate.
Whether you’re preparing for quizzes or brushing up on your knowledge, these insights will help you master the concepts effectively. Let’s dive into the correct answers and detailed explanations for each question.
1. Scenario 1, questions 1-7
As part of the data science team at Gourmet Analytics, you use data analytics to advise companies in the food industry. You clean, organize, and visualize data to arrive at insights that will benefit your clients. As a member of a collaborative team, sharing your analysis with others is an important part of your job.
Your current client is Chocolate and Tea, an up-and-coming chain of cafes.
The eatery combines an extensive menu of fine teas with chocolate bars from around the world. Their diverse selection includes everything from plantain milk chocolate, to tangerine white chocolate, to dark chocolate with pistachio and fig. The encyclopedic list of chocolate bars is the basis of Chocolate and Tea’s brand appeal. Chocolate bar sales are the main driver of revenue.
Chocolate and Tea aims to serve chocolate bars that are highly rated by professional critics. They also continually adjust the menu to make sure it reflects the global diversity of chocolate production. The management team regularly updates the chocolate bar list in order to align with the latest ratings and to ensure that the list contains bars from a variety of countries.
They’ve asked you to collect and analyze data on the latest chocolate ratings. In particular, they’d like to know which countries produce the highest-rated bars of super dark chocolate (a high percentage of cocoa). This data will help them create their next chocolate bar menu.
Your team has received a dataset that features the latest ratings for thousands of chocolates from around the world. Click here to access the dataset. Given the data and the nature of the work you will do for your client, your team agrees to use R for this project.
You create a short document about the benefits of using R for the project and share the document with your team. You write that the benefits include R’s ability to quickly process lots of data and easily reproduce and share an analysis. What is another benefit of using R for the project?
- Automatically clean data
- Define a problem and ask the right questions
- Create high-quality visualizations ✅
- Choose a topic for analysis
2. Scenario 1, continued
Before you begin working with your data, you need to import it and save it as a data frame. To get started, you open your RStudio workspace and load all the necessary libraries and packages. You upload a .csv file containing the data to RStudio and store it in a project folder named flavors_of_cacao.csv.
You use the read_csv() function to import the data from the .csv file. Assume that the name of the data frame is flavors_df and the .csv file is in the working directory. What code chunk lets you create the data frame?
- read_csv(“flavors_of_cacao.csv”) <- flavors_df
- flavors_df <- read_csv(“flavors_of_cacao.csv”)
- flavors_df + read_csv(“flavors_of_cacao.csv”)
- read_csv(flavors_df <- “flavors_of_cacao.csv”)
3. Scenario 1, continued
Now that you’ve created a data frame, you want to find out more about how the data is organized. The data frame has hundreds of rows and lots of columns.
Assume the name of your data frame is flavors_df. What code chunk lets you review the column names in the data frame?
- col(flavors_df)
- rename(flavors_df)
- colnames(flavors_df)
- arrange(flavors_df)
4. Scenario 1, continued
Next, you begin to clean your data. When you check out the column headings in your data frame you notice that the first column is named Company...Maker.if.known. (Note: The period after known is part of the variable name.) For the sake of clarity and consistency, you decide to rename this column Maker (without a period at the end).
Assume the first part of your code chunk is:
flavors_df %>%
What code chunk do you add to change the column name?
- rename(Maker %<% Company…Maker.if.known.)
- rename(Company…Maker.if.known %<% Maker)
- rename(Maker = Company…Maker.if.known.)
- rename(Company…Maker.if.known. = Maker)
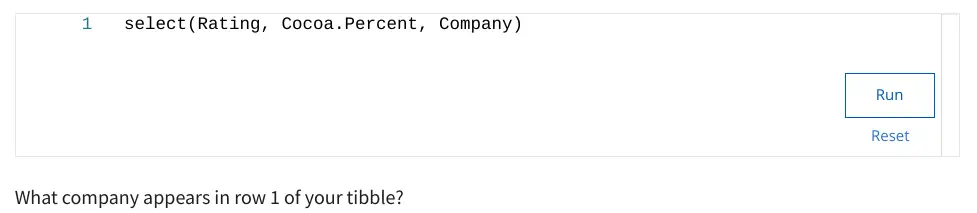
5. After previewing and cleaning your data, you determine what variables are most relevant to your analysis. Your main focus is on Rating, Cocoa.Percent, and Company. You decide to use the select() function to create a new data frame with only these three variables.
Assume the first part of your code is:
trimmed_flavors_df <- flavors_df %>%
Add the code chunk that lets you select the three variables.
- Videri
- A. Morin
- Soma
- Rogue
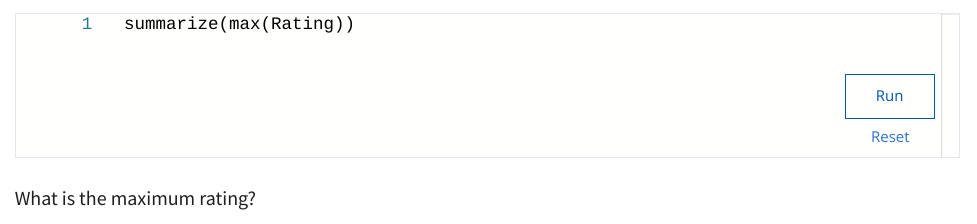
6. Next, you select the basic statistics that can help your team better understand the ratings system in your data.
Assume the first part of your code is:
trimmed_flavors_df %>%
You want to use the summarize() and max() functions to find the maximum rating for your data. Add the code chunk that lets you find the maximum value for the variable Rating.
- 4.5
- 5
- 6
- 5.5
7.After completing your analysis of the rating system, you determine that any rating greater than or equal to 3.5 points can be considered a high rating. You also know that Chocolate and Tea considers a bar to be super dark chocolate if the bar's cocoa percent is greater than or equal to 70%. You decide to create a new data frame to find out which chocolate bars meet these two conditions.
Assume the first part of your code is:
best_trimmed_flavors_df <- trimmed_flavors_df %>%
You want to apply the filter() function to the variables Cocoa.Percent and Rating. Add the code chunk that lets you filter the data frame for chocolate bars that contain at least 70% cocoa and have a rating of at least 3.5 points.
- 4.00
- 4.25
- 3.75
- 3.50
8. Now that you’ve cleaned and organized your data, you’re ready to create some useful data visualizations. Your team assigns you the task of creating a series of visualizations based on requests from the Chocolate and Tea management team. You decide to use ggplot2 to create your visuals.
Assume your first line of code is:
ggplot(data = best_trimmed_flavors_df) +
You want to use the geom_bar() function to create a bar chart. Add the code chunk that lets you create a bar chart with the variable Rating on the x-axis.
- 2
- 5
- 6
- 3
9. Your bar chart reveals the locations that produce the highest rated chocolate bars. To get a better idea of the specific rating for each location, you’d like to highlight each bar.
Assume that you are working with the following code:
ggplot(data = best_trimmed_flavors_df) +
geom_bar(mapping = aes(x = Company.Location))
Add a code chunk to the second line of code to map the aesthetic fill to the variable Rating.
NOTE: the three dots (...) indicate where to add the code chunk.
According to your bar chart, which two company locations produce the highest rated chocolate bars?
- Canada and France
- Scotland and U.S.A
- Scotland and Canada
- Amsterdam and France
10. Scenario 2, continued
A teammate creates a new plot based on the chocolate bar data. The teammate asks you to make some revisions to their code.
Assume your teammate shares the following code chunk:
ggplot(data = best_trimmed_flavors_df) +
geom_bar(mapping = aes(x = Cocoa.Percent)) +
What code chunk do you add to the third line to create wrap around facets of the variable Cocoa.Percent?
- facet_wrap(Cocoa.Percent~)
- facet_wrap(~Cocoa.Percent)
- facet(=Cocoa.Percent)
- facet_wrap(%>%Cocoa.Percent)
11. Scenario 2, continued
Your team has created some basic visualizations to explore different aspects of the chocolate bar data. You’ve volunteered to add titles to the plots. You begin with a scatterplot.
Assume the first part of your code chunk is:
ggplot(data = trimmed_flavors_df) +
geom_point(mapping = aes(x = Cocoa.Percent, y = Rating)) +
What code chunk do you add to the third line to add the title Recommended Bars to your plot?
- labs(title = “Recommended Bars”)
- labs(title = Recommended Bars)
- labs(“Recommended Bars”)
- labs(title + “Recommended Bars”)
12. Scenario 2, continued
Next, you create a new scatterplot to explore the relationship between different variables. You want to save your plot so you can access it later on. You know that the ggsave() function defaults to saving the last plot that you displayed in RStudio, so you’re ready to write the code to save your scatterplot.
Assume your first two lines of code are:
ggplot(data = trimmed_flavors_df) +
geom_point(mapping = aes(x = Cocoa.Percent, y = Rating)) +
What code chunk do you add to the third line to save your plot as a jpeg file with chocolate as the file name?
- ggsave(“chocolate.jpeg”)
- ggsave(“chocolate.png”)
- ggsave(“jpeg.chocolate”)
- ggsave(chocolate.jpeg)
13. Scenario 2, continued
As a final step in the analysis process, you create a report to document and share your work. Before you share your work with the management team at Chocolate and Tea, you are going to meet with your team and get feedback. Your team wants the documentation to include all your code and display all your visualizations.
You decide to create an R Markdown notebook to document your work. What are your reasons for choosing an R Markdown notebook? Select all that apply.
- It lets you record and share every step of your analysis
- It allows users to run your code
- It automatically creates a website to show your work
- It displays your data visualizations
14. Scenario 1, questions 1-7
As part of the data science team at Gourmet Analytics, you use data analytics to advise companies in the food industry. You clean, organize, and visualize data to arrive at insights that will benefit your clients. As a member of a collaborative team, sharing your analysis with others is an important part of your job.
Your current client is Chocolate and Tea, an up-and-coming chain of cafes.
The eatery combines an extensive menu of fine teas with chocolate bars from around the world. Their diverse selection includes everything from plantain milk chocolate, to tangerine white chocolate, to dark chocolate with pistachio and fig. The encyclopedic list of chocolate bars is the basis of Chocolate and Tea’s brand appeal. Chocolate bar sales are the main driver of revenue.
Chocolate and Tea aims to serve chocolate bars that are highly rated by professional critics. They also continually adjust the menu to make sure it reflects the global diversity of chocolate production. The management team regularly updates the chocolate bar list in order to align with the latest ratings and to ensure that the list contains bars from a variety of countries.
They’ve asked you to collect and analyze data on the latest chocolate ratings. In particular, they’d like to know which countries produce the highest-rated bars of super dark chocolate (a high percentage of cocoa). This data will help them create their next chocolate bar menu.
Your team has received a dataset that features the latest ratings for thousands of chocolates from around the world. Click here to access the dataset. Given the data and the nature of the work you will do for your client, your team agrees to use R for this project.
Your supervisor asks you to write a short summary of the benefits of using R for the project. Which of the following benefits would you include in your summary? Select all that apply.
- Quickly process lots of data
- Create high-quality data visualizations
- Define a problem and ask the right questions
- Easily reproduce and share the analysis
15. Scenario 1, continued
Before you begin working with your data, you need to import it and save it as a data frame. To get started, you open your RStudio workspace and load the tidyverse library. You upload a .csv file containing the data to RStudio and store it in a project folder named flavors_of_cacao.csv.
You use the read_csv() function to import the data from the .csv file. Assume that the name of the data frame is bars_df and the .csv file is in the working directory. What code chunk lets you create the data frame?
- bars_df %>% read_csv(“flavors_of_cacao.csv”)
- read_csv(“flavors_of_cacao.csv”) + bars_df
- bars_df <- read_csv(“flavors_of_cacao.csv”)
- bars_df + read_csv(“flavors_of_cacao.csv”)
16. Scenario 1, continued
Now that you’ve created a data frame, you want to find out more about how the data is organized. The data frame has hundreds of rows and lots of columns.
Assume the name of your data frame is flavors_df. What code chunk lets you review the structure of the data frame?
- filter(flavors_df)
- str(flavors_df)
- select(flavors_df)
- summarize(flavors_df)
17. Scenario 1, continued
Next, you begin to clean your data. When you check out the column headings in your data frame you notice that the first column is named Company...Maker.if.known. (Note: The period after known is part of the variable name.) For the sake of clarity and consistency, you decide to rename this column Brand (without a period at the end).
Assume the first part of your code chunk is:
flavors_df %>%
What code chunk do you add to change the column name?
- rename(Brand = Company…Maker.if.known.)
- rename(Company…Maker.if.known. = Brand)
- rename(Company…Maker.if.known. , Brand)
- rename(Brand, Company…Maker.if.known.)
18. After previewing and cleaning your data, you determine what variables are most relevant to your analysis. Your main focus is on Rating, Cocoa.Percent, and Company.Location. You decide to use the select() function to create a new data frame with only these three variables.
Assume the first part of your code is:
trimmed_flavors_df <- flavors_df %>%
Add the code chunk that lets you select the three variables.

What company location appears in row 1 of your tibble?
- Scotland
- Canada
- Colombia
- France
19. After completing your analysis of the rating system, you determine that any rating greater than or equal to 3.75 points can be considered a high rating. You also know that Chocolate and Tea considers a bar to be super dark chocolate if the bar's cocoa percentage is greater than or equal to 80%. You decide to create a new data frame to find out which chocolate bars meet these two conditions.
Assume the first part of your code is:
best_trimmed_flavors_df <- trimmed_flavors_df %>%
You want to apply the filter() function to the variables Cocoa.Percent and Rating. Add the code chunk that lets you filter the new data frame for chocolate bars that contain at least 80% cocoa and have a rating of at least 3.75 points.
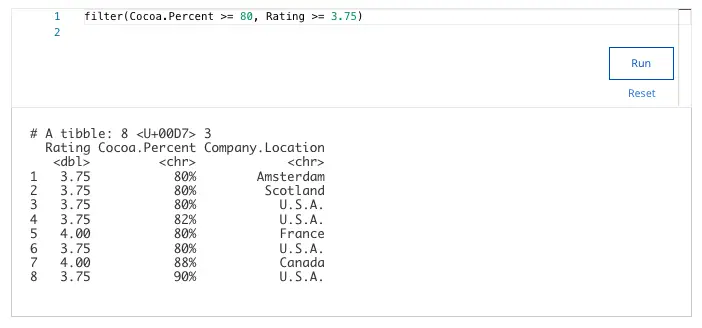
How many rows does your tibble include?
- 22
- 20
- 12
- 8
20. Scenario 2, continued
A teammate creates a new plot based on the chocolate bar data. The teammate asks you to make some revisions to their code.
Assume your teammate shares the following code chunk:
ggplot(data = best_trimmed_flavors_df) +
geom_bar(mapping = aes(x = Company)) +
What code chunk do you add to the third line to create wrap around facets of the variable Company?
- facet(Company)
- facet_wrap(+Company)
- facet_wrap(~Company)
- facet_wrap(=Company)
21. Scenario 2, continued
Your team has created some basic visualizations to explore different aspects of the chocolate bar data. You’ve volunteered to add titles to the plots. You begin with a scatterplot.
Assume the first part of your code chunk is:
ggplot(data = trimmed_flavors_df) +
geom_point(mapping = aes(x = Cocoa.Percent, y = Rating)) +
What code chunk do you add to the third line to add the title Suggested Chocolate to your plot?
- labs(title = “Suggested Chocolate”)
- labs(Suggested Chocolate = title)
- labs(Suggested Chocolate)
- labs <- “Suggested Chocolate”
22. Scenario 2, continued
Next, you create a new scatterplot to explore the relationship between different variables. You want to save your plot so you can access it later on. You know that the ggsave() function defaults to saving the last plot that you displayed in RStudio, so you’re ready to write the code to save your scatterplot.
Assume your first two lines of code are:
ggplot(data = trimmed_flavors_df) +
geom_point(mapping = aes(x = Cocoa.Percent, y = Rating)) +
What code chunk do you add to the third line to save your plot as a pdf file with “chocolate” as the file name?
- ggsave(“chocolate.png”)
- ggsave(“chocolate.pdf”)
- ggsave(“pdf.chocolate”)
- ggsave(chocolate.pdf)
23. Scenario 2, continued
As a final step in the analysis process, you create a report to document and share your work. Before you share your work with the management team at Chocolate and Tea, you are going to meet with your team and get feedback. Your team wants the documentation to include all your code and display all your visualizations.
Fill in the blank: You want to record and share every step of your analysis, let teammates run your code, and display your visualizations. You decide to create _____ to document your work.
- a database
- a spreadsheet
- an R Markdown notebook
- a data frame
24. Scenario 1, continued
Before you begin working with your data, you need to import it and save it as a data frame. To get started, you open your RStudio workspace and load the tidyverse library. You upload a .csv file containing the data to RStudio and store it in a project folder named flavors_of_cacao.csv.
You use the read_csv() function to import the data from the .csv file. Assume that the name of the data frame is chocolate_df and the .csv file is in the working directory. What code chunk lets you create the data frame?
- read_csv(“flavors_of_cacao.csv”) + chocolate_df
- chocolate_df <- “flavors_of_cacao.csv”(read_csv)
- chocolate_df <-read_csv(“flavors_of_cacao.csv”)
- chocolate_df + read_csv(“flavors_of_cacao.csv”)
25. Scenario 1, continued
Next, you begin to clean your data. When you check out the column headings in your data frame you notice that the first column is named Company...Maker.if.known. (Note: The period after known is part of the variable name.) For the sake of clarity and consistency, you decide to rename this column Company (without a period at the end).
Assume the first part of your code chunk is:
flavors_df %>%
What code chunk do you add to change the column name?
- rename(Company = Company…Maker.if.known.)
- rename(Company…Maker.if.known. <- Company)
- rename(Company…Maker.if.known. = Company)
- rename(Company <- Company…Maker.if.known.)
26. Scenario 2, continued
As a final step in the analysis process, you create a report to document and share your work. Before you share your work with the management team at Chocolate and Tea, you are going to meet with your team and get feedback. Your team wants the documentation to include all your code and display all your visualizations.
You want to record and share every step of your analysis, let teammates run your code, and display your visualizations. What do you use to document your work?
- A database
- A spreadsheet
- A data frame
- An R Markdown notebook
27. Next, you select the basic statistics that can help your team better understand the ratings system in your data.
Assume the first part of your code is:
trimmed_flavors_df %>%
You want to use the summarize() and mean() functions to find the mean rating for your data. Add the code chunk that lets you find the mean value for the variable Rating.
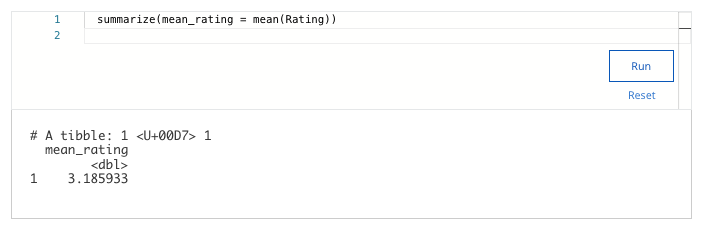
What is the mean rating?
- 3.995445
- 3.185933
- 4.701337
- 4.230765
28. Now that you’ve cleaned and organized your data, you’re ready to create some useful data visualizations. Your team assigns you the task of creating a series of visualizations based on requests from the Chocolate and Tea management team. You decide to use ggplot2 to create your visuals.
Assume your first line of code is:
ggplot(data = best_trimmed_flavors_df) +
You want to use the geom_bar() function to create a bar chart. Add the code chunk that lets you create a bar chart with the variable Company on the x-axis.
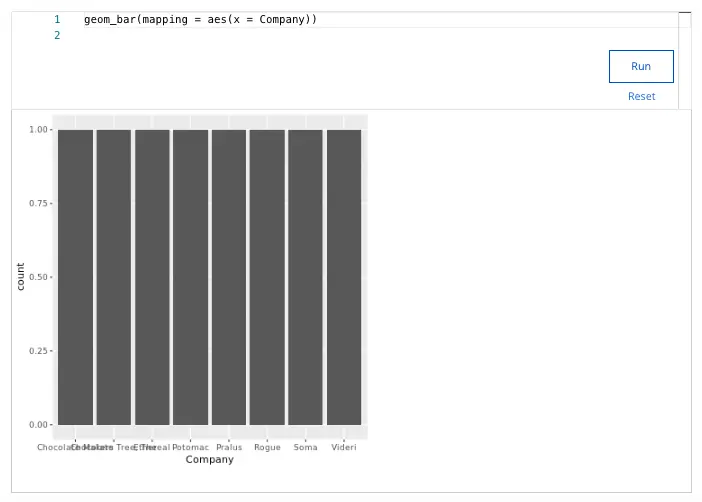
How many bars does your bar chart display?
- 6
- 4
- 8
- 10
29. Next, you select the basic statistics that can help your team better understand the ratings system in your data.
Assume the first part of your code is:
trimmed_flavors_df %>%
You want to use the summarize() and sd() functions to find the standard deviation of the rating for your data. Add the code chunk that lets you find the standard deviation for the variable Rating.
What is the standard deviation of the rating?
- 0.4458434
- 0.4780624
- 0.2951794
- 0.3720475
30. Now that you’ve cleaned and organized your data, you’re ready to create some useful data visualizations. Your team assigns you the task of creating a series of visualizations based on requests from the Chocolate and Tea management team. You decide to use ggplot2 to create your visuals.
Assume your first line of code is:
ggplot(data = best_trimmed_flavors_df) +
You want to use the geom_bar() function to create a bar chart. Add the code chunk that lets you create a bar chart with the variable Rating on the x-axis.
What is the standard deviation of the rating?
- 5
- 2
- 3
- 6
31. Scenario 2, continued
A teammate creates a new plot based on the chocolate bar data. The teammate asks you to make some revisions to their code.
Assume your teammate shares the following code chunk:
ggplot(data = best_trimmed_flavors_df) +
geom_bar(mapping = aes(x = Rating)) +
What code chunk do you add to the third line to create wrap around facets of the variable Rating?
- facet_wrap(~Rating)
- facet_wrap(Rating)
- facet(~Rating)
- facet_wrap(Rating~)
32. Scenario 2, continued
Your team has created some basic visualizations to explore different aspects of the chocolate bar data. You’ve volunteered to add titles to the plots. You begin with a scatterplot.
Assume the first part of your code chunk is:
ggplot(data = trimmed_flavors_df) +
geom_point(mapping = aes(x = Cocoa.Percent, y = Rating)) +
What code chunk do you add to the third line to add the title Best Chocolates to your plot?
- labs(“Best Chocolates”)
- labs(“Best Chocolates” = title)
- labs(title <- “Best Chocolates”)
- labs(title = “Best Chocolates”)
33. Scenario 1, questions 1-7
As part of the data science team at Gourmet Analytics, you use data analytics to advise companies in the food industry. You clean, organize, and visualize data to arrive at insights that will benefit your clients. As a member of a collaborative team, sharing your analysis with others is an important part of your job.
Your current client is Chocolate and Tea, an up-and-coming chain of cafes.
The eatery combines an extensive menu of fine teas with chocolate bars from around the world. Their diverse selection includes everything from plantain milk chocolate, to tangerine white chocolate, to dark chocolate with pistachio and fig. The encyclopedic list of chocolate bars is the basis of Chocolate and Tea’s brand appeal. Chocolate bar sales are the main driver of revenue.
Chocolate and Tea aims to serve chocolate bars that are highly rated by professional critics. They also continually adjust the menu to make sure it reflects the global diversity of chocolate production. The management team regularly updates the chocolate bar list in order to align with the latest ratings and to ensure that the list contains bars from a variety of countries.
They’ve asked you to collect and analyze data on the latest chocolate ratings. In particular, they’d like to know which countries produce the highest-rated bars of super dark chocolate (a high percentage of cocoa). This data will help them create their next chocolate bar menu.
Your team has received a dataset that features the latest ratings for thousands of chocolates from around the world. Click
here
to access the dataset. Given the data and the nature of the work you will do for your client, your team agrees to use R for this project.
A teammate asks you about the benefits of using R for the project. You mention that R can quickly process lots of data and create high quality data visualizations. What is another benefit of using R for the project?
- Choose a topic for analysis
- Easily reproduce and share an analysis
- Automatically clean data
- Define a problem and ask the right questions
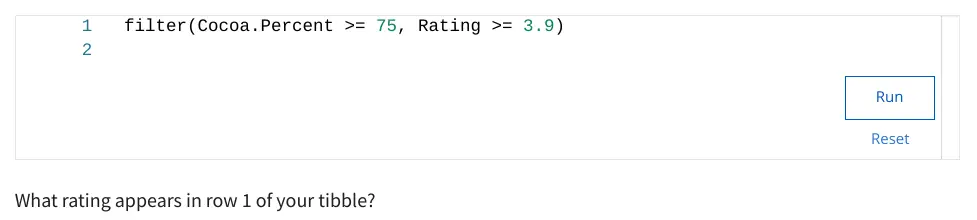
34. After completing your analysis of the rating system, you determine that any rating greater than or equal to 3.9 points can be considered a high rating. You also know that Chocolate and Tea considers a bar to be super dark chocolate if the bar's cocoa percent is greater than or equal to 75%. You decide to create a new data frame to find out which chocolate bars meet these two conditions.
Assume the first part of your code is:
best_trimmed_flavors_df <- trimmed_flavors_df %>%
You want to apply the filter() function to the variables Cocoa.Percent and Rating. Add the code chunk that lets you filter the data frame for chocolate bars that contain at least 75% cocoa and have a rating of at least 3.9 points.
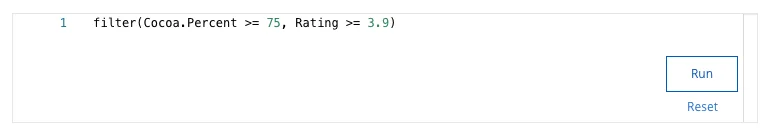
What value for cocoa percent appears in row 1 of your tibble?
- 78%
- 75%
- 80%
- 88%
35. Now that you’ve cleaned and organized your data, you’re ready to create some useful data visualizations. Your team assigns you the task of creating a series of visualizations based on requests from the Chocolate and Tea management team. You decide to use ggplot2 to create your visuals.
Assume your first line of code is:
ggplot(data = best_trimmed_flavors_df) +
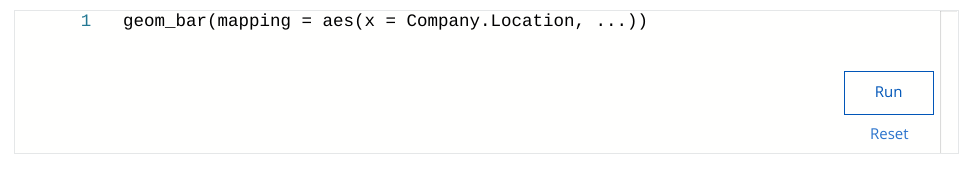
You want to use the geom_bar() function to create a bar chart. Add the code chunk that lets you create a bar chart with the variable Company.Location on the x-axis.
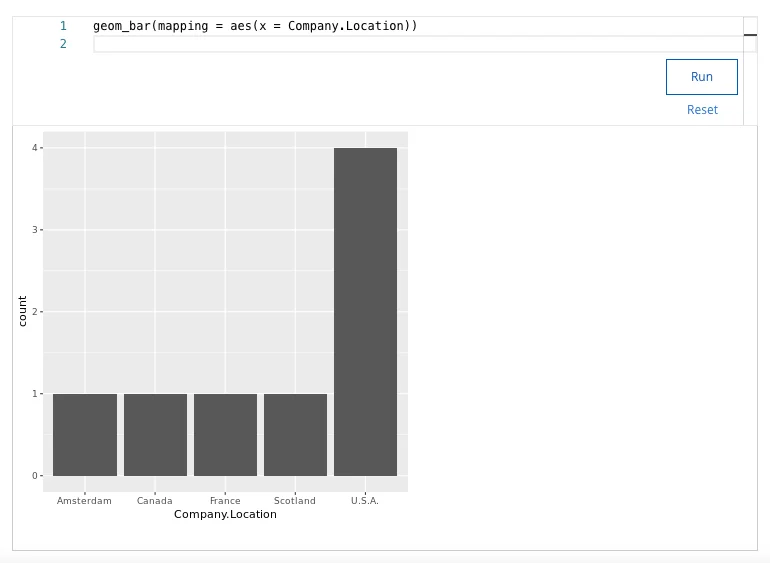
How many bars does your bar chart display?
- 3
- 6
- 5
- 4
Related contents:
Module 1: Programming and data analytics
Module 2: Programming using RStudio
Module 3: Working with data in R
Module 4: More about visualizations, aesthetics, and annotations
Module 5: Documentation and reports
You might also like:
Course 1: Foundations: Data, Data, Everywhere
Course 2: Ask Questions to Make Data-Driven Decisions
Course 3: Prepare Data for Exploration
Course 4: Process Data from Dirty to Clean
Course 5: Analyze Data to Answer Questions
Course 6: Share Data Through the Art of Visualization
Course 8: Google Data Analytics Capstone: Complete a Case Study
Thanks