
Ask Questions to Make Data-Driven Decisions Course Challenge Answers (Part 2: Q11–20)
This is Part 2 of the Module 4 quiz answers for “Ask Questions to Make Data-Driven Decisions Course Challenge” from the Google Data Analytics Professional Certificate on Coursera.
Here, we’ll walk through questions 11 to 20 with detailed explanations to support your learning.
To find answers to the remaining questions, check out the full module breakdown below:
11. Scenario 1, questions 1-5
You’ve just started a job as a data analyst at a small software company that provides data analytics and business intelligence solutions. Your supervisor asks you to kick off a project with a new client, Athena’s Story, a feminist bookstore. They have four existing locations, and the fifth shop has just opened in your community.
Athena’s Story wants to produce a campaign to generate excitement for an upcoming celebration and introduce the bookstore to the community. They share some data with your team to help make the event as successful as possible.
Your task is to review the assignment and the available data, then present your approach to your supervisor. Click the link below to access the email from your supervisor:
Then, review the email, and the Customer Survey and Historical Sales datasets.
To use the templates for the datasets, click the links below and select “Use Template.”
Links to templates: Customer Survey and Historical Sales
OR
If you don't have a Google account, you can download the CSV files directly from the attachments below.
After reading the email, you notice that the acronym WHM appears in multiple places. You look it up online, and the most common result is web host manager. That doesn’t seem right to you, as it doesn’t fit the context of a feminist bookstore. You email your supervisor to ask. When writing your email, what do you do to ensure it sounds professional? Select all that apply.
- Respect your supervisor’s time by writing an email that’s short and to the point.

- Write a clear subject line that gets a fast response so you can keep working: “WHM? NEED TO KNOW WHAT THAT IS RIGHT AWAY.”
- Read your email aloud before sending to catch any typos or grammatical errors and to ensure the communication is clear.
- Use a polite greeting and closing.
Explanation:
- Reading your email aloud helps identify errors and ensures clarity before sending.
- A concise email that gets to the point shows professionalism and respect for the recipient’s time.
- Politeness sets a professional tone and fosters a positive working relationship.
12. Scenario 1 continued
Next, you review the customer feedback in column F of the Customer Survey dataset.
To use the template for the dataset, click the link below and select “Use Template.”
Link to template: Customer Survey
OR
If you don't have a Google account, you can download the CSV file directly from the attachment below.
The attribute of column F is, “Survey Q6: What types of books would you like to see more of at Athena's Story?” In order to verify that children’s literature and feminist zines are among the most popular genres, you create a visualization. This will help you clearly identify which genres are most likely to sell well during the Women’s History Month campaign.
Your visualization looks like this:
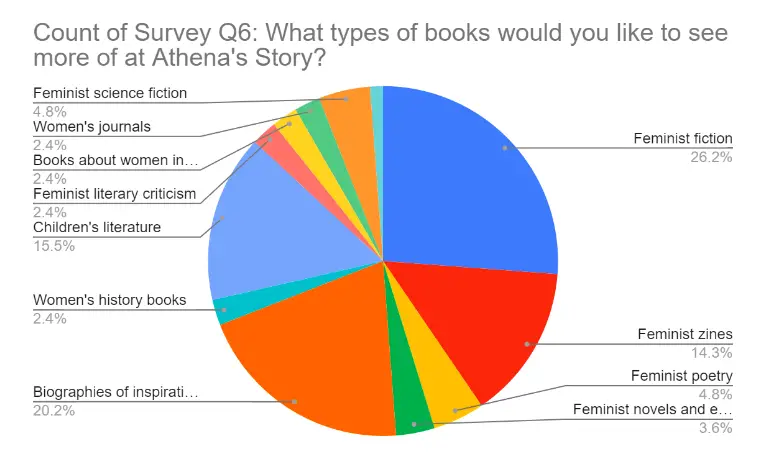
Fill in the blank: The visualization you create demonstrates the percentages of each book genre that make up the total number of survey responses. It’s called a _____ chart.
- area
- bubble
- pie
- doughnut
Explanation:
A pie chart is used to represent parts of a whole, showing how different categories contribute to the total — in this case, percentages of survey responses for book genres. Since the question emphasizes percentages and a visualization, the pie chart is the best fit.
13. Scenario 1 continued
After familiarizing yourself with the project and available data, you present your approach to your supervisor. You provide a scope of work, which includes important details, a schedule, and information on how you plan to prepare and validate the data. You also share some of your initial results and the pie chart you created.
In addition, you identify the problem type, or domain, for the data analysis project. You decide that the historical sales data can be used to provide insights into the types of books that will sell best during Women’s History Month this coming year. This will also enable you to determine if Athena’s Story should begin selling more children’s literature and feminist zines.
Using historical data to make informed decisions about how things may be in the future is an example of identifying themes.
- True
- False
Explanation:
A pie chart is used to represent parts of a whole, showing how different categories contribute to the total — in this case, percentages of survey responses for book genres. Since the question emphasizes percentages and a visualization, the pie chart is the best fit.
14. Scenario 2 continued
Next, the vice president wants to understand your knowledge about asking effective questions. Consider and respond to the following question. Select all that apply.
Let’s say we just completed a big event for a client and wanted to find out if they were satisfied with their experience. Provide some examples of measurable questions that you could include in the customer feedback survey.
- Would you recommend Patel Events Plus to a colleague or friend? Yes or no?
- How would you describe your event experience?
- Why did you enjoy the event planned by Patel Events Plus?
- On a scale from 1 to 5, with 1 being not at all likely and 5 being very likely, how likely are you to recommend Patel Events Plus?
Explanation:
Measurable questions collect quantitative data (i.e., data that can be counted or scored).
- Yes/No questions yield binary numeric data.
- Likert scales (1 to 5) allow for statistical analysis.
The other two questions are open-ended and yield qualitative data.
15. Scenario 2 continued
Now, the vice president presents a situation having to do with resolving challenges and meeting stakeholder expectations. Consider and respond to the following question.
You’re working on a rush project, and you discover your dataset is not clean. Even though it has numerous nulls, redundant data, and other issues, the primary stakeholder insists that you move ahead and use it anyway. The project timeline is so tight that there simply isn’t enough time for cleaning. How would you handle that situation?
- Communicate the situation to your supervisor and ask for advice on how to handle the situation with the stakeholder.
- The stakeholder is in charge. It’s best to do as they say and use the unclean dataset.
- Clean the data as quickly as you can. It’s not perfect, but it’s better than it was before, and this way you can meet the deadline.
- Contact the stakeholder’s boss to let them know about the issue and ask for help managing the stakeholder’s expectations.
Explanation:
This shows good professional judgment and ethical responsibility. A supervisor can help balance stakeholder demands with data quality standards. Acting without consultation can cause reputational or analytical harm.
16. Scenario 2 continued
Your next interview question deals with sharing information with stakeholders. Consider and respond to the following question.
Let’s say you want to share information about an upcoming event with stakeholders. It’s important that they’re able to access and interact with the data in real time. Would you create a report or a dashboard?
- Report
- Dashboard

Explanation:
Dashboards are interactive and provide real-time updates, making them ideal for ongoing monitoring.
17. Scenario 1, questions 1-5
You’ve just started a job as a data analyst at a small software company that provides data analytics and business intelligence solutions. Your supervisor asks you to kick off a project with a new client, Athena’s Story, a feminist bookstore. They have four existing locations, and the fifth shop has just opened in your community.
Athena’s Story wants to produce a campaign to generate excitement for an upcoming celebration and introduce the bookstore to the community. They share some data with your team to help make the event as successful as possible.
Your task is to review the assignment and the available data, then present your approach to your supervisor. Click the link below to access the email from your supervisor:
Then, review the email, and the Customer Survey and Historical Sales datasets.
To use the templates for the datasets, click the links below and select “Use Template.”
Links to templates: Customer Survey and Historical Sales
OR
If you don't have a Google account, you can download the CSV files directly from the attachments below.
After reading the email, you notice that the acronym WHM appears in multiple places. You look it up online, and the most common result is web host manager. That doesn’t seem right to you, as it doesn’t fit the context of a feminist bookstore. Still, you should assume it’s correct and continue with the project.
- True
- False
Explanation:
Making assumptions without context is a poor analytical practice. Since it’s a feminist bookstore, a more fitting meaning is Women’s History Month. Verifying the meaning is critical.
18. Scenario 1 continued
Now that you know WHM stands for Women’s History Month, you continue reviewing the datasets. You notice that the Customer Survey dataset contains both qualitative and quantitative data.
To use the template for the dataset, click the link below and select “Use Template.”
Link to template: Customer Survey
OR
If you don't have a Google account, you can download the CSV file directly from the attachment below.
The qualitative data includes information from which columns? Select all that apply.
- Column F (Survey Q6: What types of books would you like to see more of at Athena’s Story?)
- Column E (Survey Q5: What do you like most about Athena’s Story?)
- Column B (Survey Q2: If answered “Yes” to Q1, how do you plan to celebrate?)
- Column D (Survey Q4: If answered “Yes” to Q3, how many books do you typically purchase during March?)
Explanation:
Qualitative data is descriptive and non-numerical. These columns contain open-ended text responses, which are best categorized or coded for analysis.
Column D is quantitative because it asks how many books, resulting in numeric data.
19. Scenario 2, questions 6-10
You’ve completed this program and are now interviewing for your first junior data analyst position. You’re hoping to be hired by an event planning company, Patel Events Plus. Access the job description below:
So far, you’ve successfully completed the first round of interviews with the human resources manager and director of data and strategy. Now, the vice president of data and strategy wants to learn more about your approach to managing projects and clients. Access the email you receive from the human resources director below:
You arrive Thursday at 1:45 PM for your 2 PM interview. Soon, you’re taken into the office of Mila Aronowicz, vice president of data and strategy. After welcoming you, she begins the behavioral interview.
First, she hands you a copy of Patel Events Plus’s organizational chart. Access the chart below:
As you’ve learned in this course, stakeholders are people who invest time, interest, and resources into the projects you’ll be working on as a data analyst. Secondary stakeholders are also typically responsible for managing the data. Based on what you find in the organizational chart, which of the secondary stakeholders are responsible for managing the data? Select all that apply.
- Project manager, analytics
- Data analytics coordinator

- Junior data analyst
- Project manager, strategy
Explanation:
- Responsible for overseeing data management tasks.
- Works on processing and managing data under guidance.
20. Scenario 2 continued
Now, the vice president presents a situation having to do with resolving challenges and meeting stakeholder expectations. Consider and respond to the following question.
You’re working with a dataset that the data analytics coordinator should have cleaned, but it turns out that it wasn’t. Your supervisor thought the dataset was ready for use, but you discover nulls, redundant data, and other issues. The project is due in less than two weeks. How would you handle that situation?
- Communicate with the data analytics coordinator about the issue and offer to work together to clean the data so the project doesn’t fall behind.
- Call a formal meeting with the data analytics team to solve the problem. Do not invite the associate data analyst, as they clearly don’t have time to help.
- Contact the data analytics coordinator and insist they clean the dataset immediately so you don’t miss your project deadline.
- Email your supervisor to let them know the associate data analyst did not complete their assigned task.
Explanation:
Collaborating shows teamwork and accountability. Blaming others or escalating without discussion can damage professional relationships. This approach also keeps the project on track.
Hope this helped! Use the buttons below to move to the previous or next part.