Module 4: Become a Fair and Impactful Data Professional Answers (Part 4: Q46–53)

This is Part 4 of the Module 1 quiz answers for “Become a Fair and Impactful Data Professional” from the Google Data Analytics Professional Certificate on Coursera.

Here, we’ll walk through questions 46 to 53 with detailed explanations to support your learning.

To find answers to the remaining questions, check out the full module breakdown below:

46. A company is curious about the population trend in Charlotte, NC. A data analyst in the company is tasked with creating a visualization that depicts such information. What type of chart would be best for this task and why?

  • A pie chart because it plots a sequence of points and connects them with straight lines or curves.
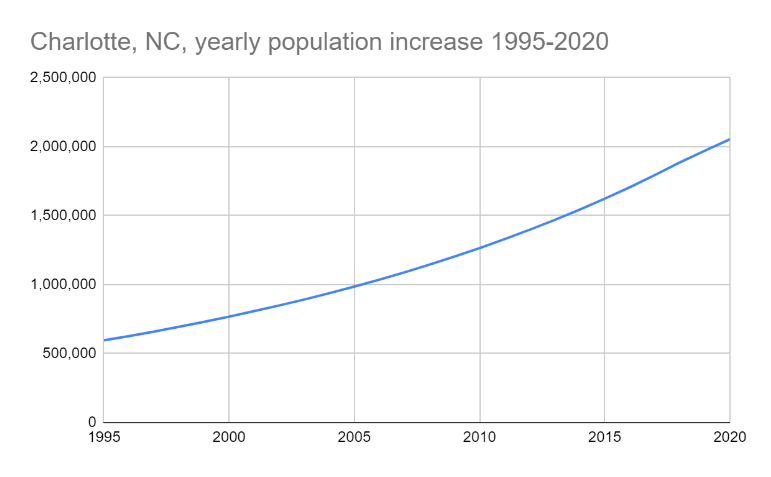
  • A line chart because it plots a sequence of points and connects them with straight lines or curves. ✅
  • A line chart because it is a visualization that uses a circle which is divided into wedges sized based on numerical proportion.
  • A bar chart because it is a visualization that represents data with columns, or bars, the heights of which are proportional to the values that they represent.

Explanation:
A line chart is suitable for showing trends over time. It effectively displays changes in population by connecting data points sequentially.
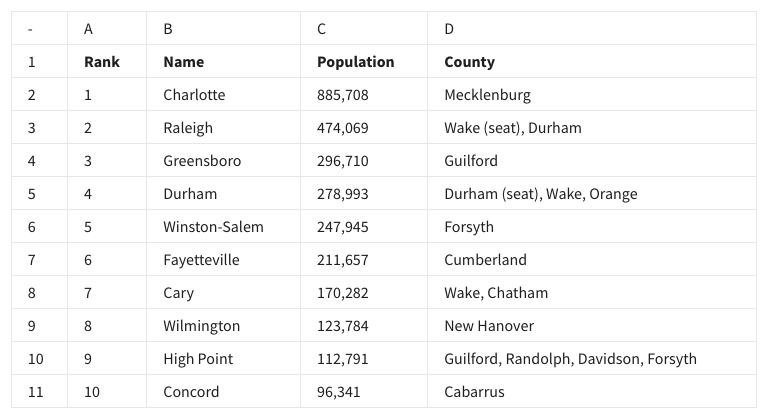
47. To find the average population of the cities in this spreadsheet, what is the correct AVERAGE function syntax? Type your answer below.

  • AVERAGE(C2-C11)
  • =AVERAGE(C2-C11)
  • =AVERAGE(C2:C11) ✅
  • AVERAGE(C2:C11)

Explanation:
Correct formula syntax for calculating average in a range.

48. You are working with a database table that contains invoice data. The customer_id column lists the ID number for each customer. You are interested in invoice data for the customer with ID number 50.

You write the SQL query below. Add a WHERE clause that will return only data about the customer with ID number 50.

After you run your query, use the slider to view all the data presented.

What is the billing city for the customer with ID number 50?

  • Paris
  • Bangalore
  • Tokyo
  • Madrid ✅

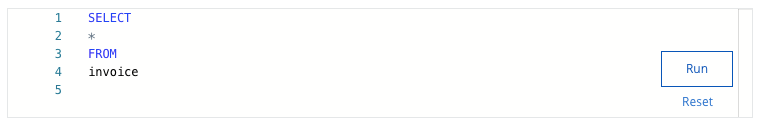
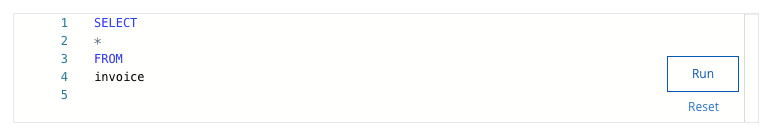
Explanation:
SELECT * FROM invoice WHERE customer_id = 50; and read the billing city.

49. Fill in the blank: A data analyst has to demonstrate how the population in a city has increased over time. In particular, they want to be able to see when the population has exceeded certain thresholds. The chart that would work best for this is a/an _____ chart.

  • area
  • line ✅
  • bar
  • column

Explanation:
Thresholds and changes over time are best visualized with a line chart.

50. The function =AVG_pop(C2:C11) will calculate the average population across the cities in this spreadsheet.

  • True
  • False ✅

Explanation:
This is an invalid function. The correct one is =AVERAGE(C2:C11).

51. A data analyst has to demonstrate how the population in Charlotte has increased over time. They create the chart below. What is this type of chart called?

  • Area chart
  • Column chart
  • Line chart ✅
  • Bar chart

Explanation:
Because it connects time-sequenced data points.

52. In the following spreadsheet, the feature sort range was used to do what?

  • Randomize the rank
  • Randomize the population
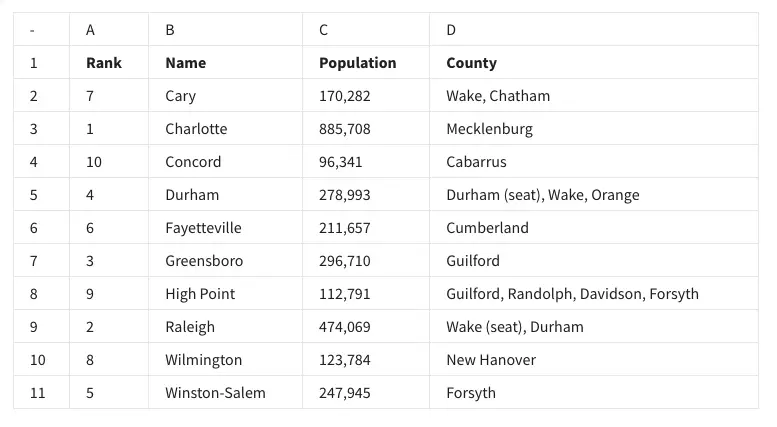
  • Alphabetize column B ✅
  • Alphabetize column D

Explanation:
Sorting the range has reordered the data in column B (the “Name” column) alphabetically while keeping the rest of the data aligned with each corresponding row.

53. You are working with a database table that contains invoice data. The customer_id column lists the ID number for each customer. You are interested in invoice data for the customer with ID number 7.

You write the SQL query below. Add a WHERE clause that will return only data about the customer with ID number 7.

After you run your query, use the slider to view all the data presented.

What is the billing country for the customer with ID number 7?

  • France
  • Austria ✅
  • Poland
  • Brazil

Explanation:
SQL query filtered by customer_id = 7; read the billing_country field.

Congratulations! You’ve completed all 53 questions. Share this post if it helped you, and check out other Coursera quiz answers below.

Leave a Reply