
Prepare data for exploration course challenge
1. Scenario 1, questions 1-5
You’ve been working at a data analytics consulting company for the past six months. Your team helps restaurants use their data to better understand customer preferences and identify opportunities to become more profitable.
To do this, your team analyzes customer feedback to improve restaurant performance. You use data to help restaurants make better staffing decisions and drive customer loyalty. Your analysis can even track the number of times a customer requests a new dish or ingredient in order to revise restaurant menus.
Currently, you’re working with a vegetarian sandwich restaurant called Garden. The owner wants to make food deliveries more efficient and profitable. To accomplish this goal, your team will use delivery data to better understand when orders leave Garden, when they get to the customer, and overall customer satisfaction with the orders.
Before project kickoff, you attend a discovery session with the vice president of customer experience at Garden. He shares information to help your team better understand the business and project objectives. As a follow-up, he sends you an email with datasets.
Reviewing the data enables you to describe how you will use it to achieve your client’s goals. First, you notice that all of the data was collected by Garden employees using their own resources. What type of data does this describe?
- Third-party data
- First-party data
- Nominal data
- Qualitative data
2. Scenario 1 continued
Next, you review the customer satisfaction survey data. To use the template for the customer satisfaction survey data, click the link below and select “Use Template.”
Link to template: Customer Satisfaction Survey data
OR
If you don’t have a Google account, download the CSV file directly from the attachment below.
The question in column E asks, “Was your order accurate? Please respond yes or no.” The responses listed in column E are an example of Boolean data.
- True
- False
3. Scenario 1 continued
Now, you review the data on delivery times and the distance of customers from the restaurant.
To use the template for the dataset, click the link below and select “Use Template.”
Link to template: Delivery Times/Distance
OR
If you don’t have a Google account, download the CSV file directly from the attachment below.
The data in column E shows the duration of deliveries from Garden to customers. What type of data is this? Select all that apply.
- Continuous data
- Quantitative data
- Qualitative data
- Discrete data
4. Scenario 1 continued
The next thing you review is the file containing pictures of sandwich deliveries over a period of 30 days. This is an example of structured data.
- True
- False
5. Scenario 1 continued
Now that you’re familiar with the data, you want to build trust with the team at Garden. You decide to impress them by taking the initiative to reach out to your social media followers. You explain that Garden is a new client, and you show them the pictures of Garden’s sandwich deliveries from the client file. Then, you ask them if they have any photos of sandwich deliveries that you can evaluate.
This is an example of going above and beyond expectations and a great way to build trust.
- True
- False
6. Scenario 2, questions 6-10
You’ve completed this program and are interviewing for a junior data scientist position at a company called Sewati Financial Services.
So far, you’ve successfully completed the first interview with a recruiter. They arrange your second interview with the team at Sewati Financial Services.
You arrive 15 minutes early for your interview. Soon, you are escorted into a conference room, where you meet Kai Harvey, the senior manager of strategy. After welcoming you, he begins the behavioral interview.
Consider and respond to the following question. Select all that apply.
Our data analytics team often surveys clients to get their feedback. If you were on the team, how would you ensure the process does not cause potential bias?
- Make sure the wording of the survey question does not encourage a specific response from participants.
- Include clients with disabilities in the survey sample.
- Give participants enough time to answer each survey question.
- Instruct participants to share their name and contact information.
7. Scenario 2 continued
Consider and respond to the following question. Select all that apply.
Our data analytics team often uses external data. Where can you access useful external data?
- A public database
- An open-data website
- Sewati Financial Services database in the cloud
- Sewati Financial Services website
8. Scenario 2 continued
Consider and respond to the following question. Select all that apply.
Our analysts often work within the same spreadsheet, but for different purposes. What tools would you use in such a situation?
- Freeze the header rows
- Sort the data to make it easier to understand, analyze, and visualize
- Filter to show only the data that meets a specific criteria
- Encrypt the spreadsheet so only you can access it
9. Scenario 2 continued
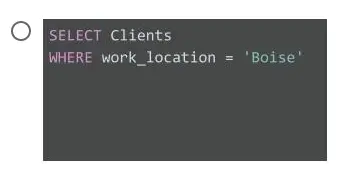
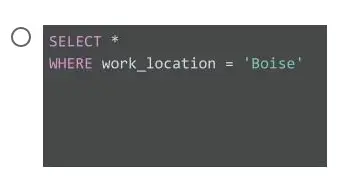
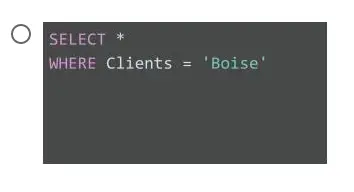
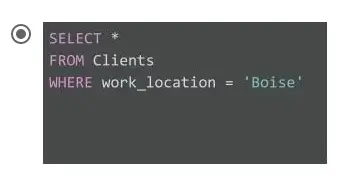
Next, your interviewer wants to better understand your knowledge of basic SQL commands. He asks: How would you write a query that retrieves only data about people who work in Boise from the Clients table in our database?
10. Scenario 2 continued
For your final question, your interviewer explains that Sewati Financial Services cares about data privacy. The company needs its clients’ trust, and this is an important responsibility for the data analytics team.
He asks: What does data privacy involve? Select all that apply.
- Encryption and sharing permissions
- Preserving a data subject’s information and activity any time a data transaction occurs
- Putting privacy measures in place to protect people’s data
- A person’s legal right to their data
11. Scenario 1, questions 1-5
You’ve been working at a data analytics consulting company for the past six months. Your team helps restaurants use their data to better understand customer preferences and identify opportunities to become more profitable.
To do this, your team analyzes customer feedback to improve restaurant performance. You use data to help restaurants make better staffing decisions and drive customer loyalty. Your analysis can even track the number of times a customer requests a new dish or ingredient in order to revise restaurant menus.
Currently, you’re working with a vegetarian sandwich restaurant called Garden. The owner wants to make food deliveries more efficient and profitable. To accomplish this goal, your team will use delivery data to better understand when orders leave Garden, when they get to the customer, and overall customer satisfaction with the orders.
Before project kickoff, you attend a discovery session with the vice president of customer experience at Garden. He shares information to help your team better understand the business and project objectives. As a follow-up, he sends you an email with datasets.
Click below to read the email:
And click below to access the datasets:
Reviewing the data enables you to describe how you will use it to achieve your client’s goals. First, you notice that all of the data is first-party data. What does this mean?
- It’s data that was collected from outside sources.
- It’s data that was collected by Garden employees using the company’s own resources.
- It’s a type of data that’s categorized without a set order.
- It’s subjective data that measures qualities and characteristics.
12. Scenario 1 continued
Next, you review the customer satisfaction survey data. To use the template for the customer satisfaction survey data, click the link below and select “Use Template.”
Link to template: Customer Satisfaction Survey data
OR
If you don’t have a Google account, download the CSV file directly from the attachment below.
You notice that the data in column E is an example of Boolean data. Why did you come to this conclusion?
- It has each subject in multiple rows.
- It is qualitative data with a set order or scale.
- It has only two possible values.
- It is organized in a certain format, such as rows and columns.
13. Scenario 1 continued
Now, you review the data on delivery times and the distance of customers from the restaurant.
To use the template for the dataset, click the link below and select “Use Template.”
Link to template: Delivery Times/Distance
OR
If you don’t have a Google account, download the CSV file directly from the attachment below.
Fill in the blank: The data in column E is an example of _____ data. Select all that apply.
- continuous
- qualitative
- discrete
- quantitative
14. Scenario 1 continued
The next thing you review is the file containing pictures of sandwich deliveries over a period of 30 days. What type of data is this?
- Ordinal
- Unstructured
- Discrete
- Relational
15. Scenario 1 continued
Now that you’re familiar with the data, you want to build trust with the team at Garden.
What actions should you take when working with their data? Select all that apply.
- Keep the data safe by implementing data-security measures, such as password protection and user permissions.
- Share the client’s data with other delivery restaurants to compare performance.
- Post on social media that you’re working with Garden and would like feedback from any of your contacts who have ordered there before.
- Organize the data using effective naming conventions.
16. Scenario 2, questions 6-10
You’ve completed this program and are interviewing for a junior data scientist position at a company called Sewati Financial Services.
Click below to review the job description:
So far, you’ve successfully completed the first interview with a recruiter. They arrange your second interview with the team at Sewati Financial Services.
Click below to read the email from the human resources director:
You arrive 15 minutes early for your interview. Soon, you are escorted into a conference room, where you meet Kai Harvey, the senior manager of strategy. After welcoming you, he begins the behavioral interview.
Consider and respond to the following question. Select all that apply.
Our data analytics team often surveys clients to get their feedback. If you were on the team, how would you ensure the sample is representative of the population as a whole?
- Only include participants who can answer survey questions in a timely manner.
- Make sure the sample is chosen at random.
- Include clients with disabilities in the survey sample.
- Use a randomized sample of the population that includes all genders.
17. Scenario 2 continued
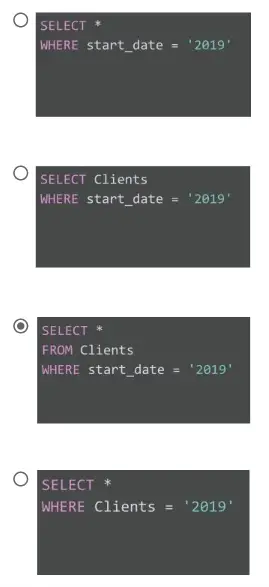
Next, your interviewer wants to better understand your knowledge of basic SQL commands. He asks: How would you write a query that retrieves only data about people who joined our firm in 2019 from the Clients table in our database?
18. Scenario 2 continued
For your final question, your interviewer explains that Sewati Financial Services cares about its clients’ trust, and this is an important responsibility for the data analytics team. They do this by:
protecting clients from unauthorized access to their private data
ensuring freedom from inappropriate use of client data
getting consent to use someone’s data
He asks: Which data analytics practice does this describe?
- Encryption
- Bias
- Data privacy
- Sharing permissions
19. Scenario 1 continued
Next, you review the customer satisfaction survey data. To use the template for the customer satisfaction survey data, click the link below and select “Use Template.”
Link to template: Customer Satisfaction Survey data
OR
If you don’t have a Google account, download the CSV file directly from the attachment below.
The question in column E asks, “Was your order accurate? Please respond yes or no.” What kind of data is this?
- Second-party data
- Ordinal data
- Clean data
- Boolean data
20. Scenario 1 continued
The next thing you review is the file containing pictures of sandwich deliveries over a period of 30 days. This is unstructured data, which means what?
- It’s organized in a certain format.
- It’s not organized in an easily identifiable manner.
- It’s objective and measures facts.
- It’s collected by a group directly from its audience and then sold.
21. Scenario 2 continued
Consider and respond to the following question. Select all that apply.
Our data analytics team often uses external data. Where can you locate useful external data?
- Other financial businesses
- Sewati Financial Solutions marketing department
- Government sources
- A professional finance association
22. Scenario 2 continued
Consider and respond to the following question.
Our analysts often work within the same spreadsheet, but for different purposes. How could filtering help in this situation?
- Filtering enables you to highlight the header row
- Filtering enables you to sort the data in a meaningful order
- Filtering simplifies a spreadsheet by only showing you the information you need
- Filtering encrypts the spreadsheet so only you can access it
23. Scenario 1 continued
Now that you’re familiar with the data, you want to build trust with the team at Garden.
What data-security measures do you employ? Select all that apply.
- Add passwords to files
- Make personal copies of client files
- Assign user permissions for files
- Change their file naming conventions
24. Scenario 1, questions 1-5
You’ve been working at a data analytics consulting company for the past six months. Your team helps restaurants use their data to better understand customer preferences and identify opportunities to become more profitable.
To do this, your team analyzes customer feedback to improve restaurant performance. You use data to help restaurants make better staffing decisions and drive customer loyalty. Your analysis can even track the number of times a customer requests a new dish or ingredient in order to revise restaurant menus.
Currently, you’re working with a vegetarian sandwich restaurant called Garden. The owner wants to make food deliveries more efficient and profitable. To accomplish this goal, your team will use delivery data to better understand when orders leave Garden, when they get to the customer, and overall customer satisfaction with the orders.
Before project kickoff, you attend a discovery session with the vice president of customer experience at Garden. He shares information to help your team better understand the business and project objectives. As a follow-up, he sends you an email with datasets.
Click below to read the email:
And click below to access the datasets:
Reviewing the data enables you to describe how you will use it to achieve your client’s goals. First, you notice that all of the data is first-party data, which means that it was collected from outside sources.
- True
- False