
- To allow all of the text to fit inside a cell ✅

- To allow text to overflow into an adjacent cell
- To remove text that is too long to fit in a cell
- To clip text within a cell so it doesn’t overflow into an adjacent cell
Explanation:
Text wrapping is used to make all the text in a cell visible by wrapping the text to fit within the cell’s boundaries. This prevents text from being cut off or overflowing into adjacent cells, ensuring readability without affecting the layout of the spreadsheet.
- True ✅

- False
Explanation:
Spreadsheet applications like Excel and Google Sheets label columns with letters (A, B, C, etc.) and rows with numbers (1, 2, 3, etc.). This grid-like structure helps in identifying cells using a combination of column letters and row numbers, such as A1 or B2.


- Select the LastName column from the employee table
- Select all columns from the employee table ✅

- Select all data that meets the criteria as stated in the query, then multiply it
- Select all data that meets the criteria as stated in the query
Explanation:
The asterisk (*) in an SQL SELECT statement indicates that all columns in the specified table (in this case, employee) should be included in the result set.

- jobCode
- LastName
- employee ✅

- James
Explanation:
The FROM employee clause specifies the table from which the data will be retrieved. In this query, the data is being retrieved from the employee table.

- All data from the employee table, where the jobCode is FTE and the last name is James. ✅

- All data from the FTE table, where the employee’s LastName is James.
- All data from the jobCode table, where the jobCode is FTE and the employee has any last name other than James.
- All data from the employee table, where the jobCode is FTE and the employee has any last name other than James.
Explanation:
The query uses the WHERE clause to filter results. It retrieves all rows from the employee table where the jobCode is 'FTE' and the LastName is 'James'. Since * is used, all columns for these rows will be returned.

- 2 ✅

- 8
- 5
- 9
Explanation:
The FROM clause specifies the table (artist) from which data should be retrieved. The asterisk (*) indicates that all columns in the artist table should be included in the result set.
How many columns are in the artist table?

- Vivaldi: The Four Seasons
- Beethoven: Piano Sonatas
- Mozart: Chamber Music
- Bach: Goldberg Variations ✅

- graphical ✅

- tabulated
- contextual
- attributed
Explanation:
Data visualizations use graphical elements such as charts, graphs, and plots to represent information, making complex data easier to understand.
- When showing a class broken down by age ✅

- When showing the ages of males versus females
- When showing the relationship between age and income
- When showing a change in someone’s age over time
Explanation:
A pie chart is most effective when displaying proportions or percentages of a whole, such as the breakdown of a class by age groups. It is not suitable for comparisons or trends over time.
- They can ensure that you get fewer questions about your analysis
- They can illustrate relationships between data points ✅

- They can help stakeholders understand complex data more quickly ✅

- They can clearly demonstrate patterns and trends ✅

Explanation:
Data visualizations are powerful tools that make it easier to identify relationships, patterns, and trends in data. They also help stakeholders quickly grasp complex information. However, visualizations do not necessarily reduce the number of questions about your analysis, as stakeholders might ask for more details or clarifications.

- Criteria
- Attributes ✅

- Descriptors
- Characteristics
Explanation:
Column labels in the first row of a spreadsheet define the type of data contained in each column. These labels are referred to as attributes, representing the variables or properties of the data set.
- format
- attribute
- criteria
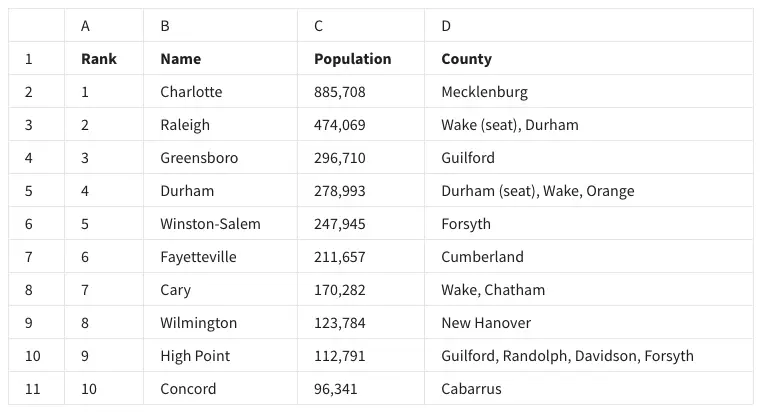
- observation ✅
Explanation:
In data analysis, an observation refers to a single record or data point. In a spreadsheet, each row represents an observation, containing all the attribute values for a specific entity. Therefore, row 8 contains the observation for Cary.
- Organize range
- Name range
- Randomize range
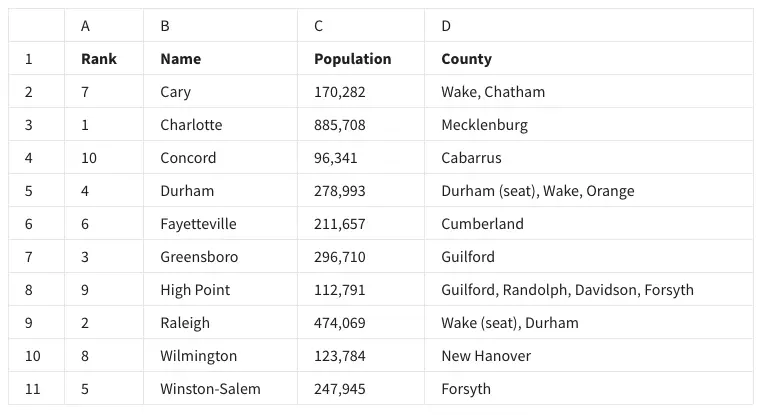
- Sort range ✅
Explanation:
The “Sort range” feature allows users to sort data within a specific range of cells. By selecting column B and applying “Sort range,” the city names can be alphabetized while maintaining the integrity of the corresponding data in other columns.
- =AVERAGE(C2-C11)
- AVERAGE(C2:C11)
- AVERAGE(C2-C11)
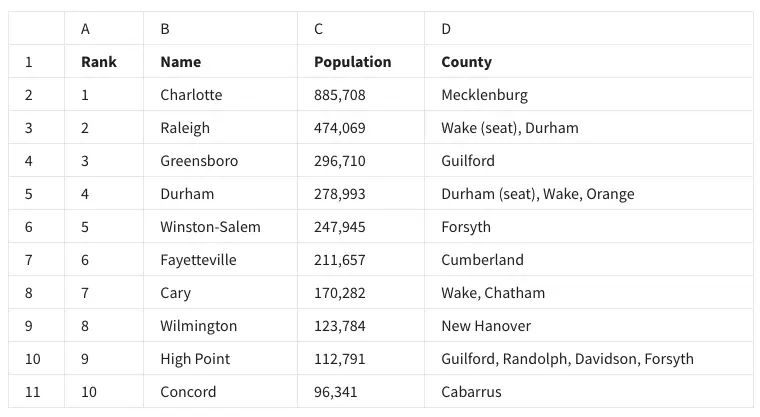
- =AVERAGE(C2:C11) ✅
Explanation:
The correct function to calculate the average of a range of numbers in spreadsheet software is AVERAGE. The correct syntax is =AVERAGE(C2:C11), which computes the average of the values in cells C2 through C11.