
35. Scenario 1, continued
Now, you want to highlight what your team’s analysis discovered about the number of charging stations available compared to the number of cars purchased. Your data has confirmed that the lack of charging stations causes the effect of fewer car sales. To communicate this effectively, you will need to convey causation to the stakeholders.
Fill in the blank: You explain that causation is when an action _____ an outcome. In the case of Gaea’s business, causation can be used to discuss the relationship between lack of charging stations and fewer car sales.
- changes the timing of
- directly leads to
- moves in relationship to
- prevents occurrence of
36. Scenario 1, continued
After creating data visualizations about the current state of the electric vehicle market, you turn to projections. You want to communicate to stakeholders about the importance of longer vehicle battery range to consumers.
Your team analyzes data from a consumer survey that investigated the importance of longer battery range when choosing whether to purchase an electric car. The current average battery range is about 210 miles. By 2025, that distance is expected to grow to 450 miles per charge.
You create the following pie chart:
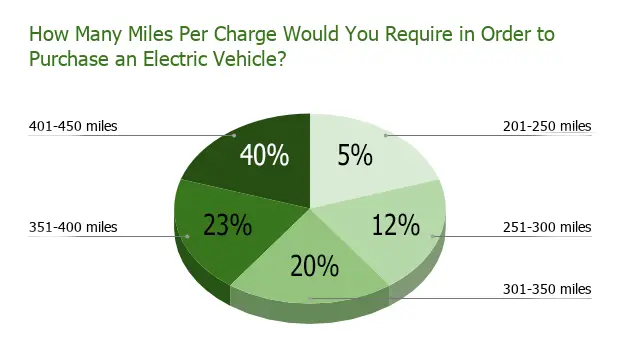
After reviewing your pie chart, you realize that it could be improved. How do you make this chart more effective?
- Remove the labels for the number of miles per charge consumers will require before purchasing an electric vehicle
- Write a longer title to add more detail about the data the pie chart contains
- Add an x-axis and y-axis to provide additional explanation about the data
- Resize the pie segments so they visually show the different values
37. Scenario 2, continued
Next, you prepare for the question-and-answer session that will follow your presentation. What methods help you predict what questions your audience may ask? Select all that apply.
- Make sure you have a clear understanding of Gaea stakeholder objectives
- Do a test-run, or colleague test, of your presentation
- Be prepared to consider and describe any limitations of your data
- Add automotive jargon to your presentation to demonstrate that you understand these industry terms.
38. Scenario 2, continued
Now that you have some idea of the questions the stakeholders may ask, you consider potential objections. How do you ensure you are prepared for any potential objections? Select all that apply.
- Keep a detailed log of your data-cleaning process
- Be sure to include numerous perspectives during the analysis process
- Assure stakeholders that your analysis process is private so it cannot be reproduced by others
- Include information on where the data came from in an appendix
39. Scenario 1, continued
Next, you decide on your data narrative’s characters, setting, plot, big reveal, and aha moment. The characters are the people affected by your story. This includes your stakeholders, Gaea’s customers, and Gaea’s potential future customers. For the setting, you describe the current situation, potential tasks, and background information about the analysis project.
As you begin to work on the plot for the data narrative, which of the following ideas would you include? Select all that apply.
- How your data analysis can help Gaea solve its business problems
- The challenges associated with the current lack of vehicle charging stations
- A list of your recommendations and details about why they will help Gaea be successful
- Why it’s important for Gaea to increase its cars’ battery range by 2025
40. Scenario 1, continued
Next, you decide on your data narrative’s characters, setting, plot, big reveal, and aha moment. During the narrative, you want to communicate to your stakeholders about the challenges associated with the current lack of vehicle charging stations and why it's important for Gaea to increase its cars’ battery range by 2025.
The setting of your data story will include information about charging stations, the need to increase battery range, and why it’s important for Gaea to increase its cars’ battery range.
- True
- False
41. Scenario 1, continued
Once you finish creating data visualizations about the current state of the electric vehicle market, you turn to projections for the future. You want to communicate to stakeholders about the importance of longer vehicle battery range to consumers.
Your team’s data includes feedback from a consumer survey that investigated the importance of longer battery when choosing whether to purchase an electric car. The current average battery range is about 210 miles. By 2025, that range is expected to grow to 450 miles per charge.
You create the following pie chart:
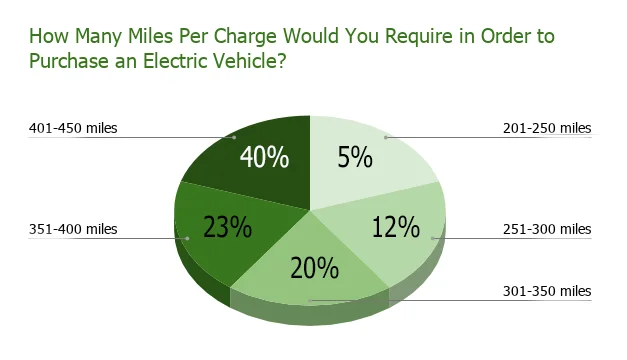
After reviewing your pie chart, you realize that it could be improved by resizing the segments. Resizing the segments in proportion to each segment's relative value enables you to visually show the different values.
- True
- False
