
37. You are working with the penguins dataset. You create a scatterplot with the following code chunk:
ggplot(data = penguins) +
geom_point(mapping = aes(x = flipper_length_mm, y = body_mass_g))
You want to highlight the different years of data collection on your plot. Add a code chunk to the second line of code to map the aesthetic alpha to the variable island.
NOTE: the three dots (...) indicate where to add the code chunk. You may need to scroll in order to find the dots.
What islands does your visualization display?
- Biscoe, Dream, Torgersen
- Cebu, Borneo, Torgersen
- Cebu, Java, Hispaniola
- Biscoe, Java, Buton
38. What function creates a scatterplot and then adds a small amount of random noise to each point in the plot to make the points easier to find?
- The geom_smooth() function
- The geom_jitter() function
- The geom_point() function
- The geom_bar() function
39. A data analyst wants to add text elements inside the grid area of their plot. Which ggplot function allows them to do this?
- annotate()
- labs()
- facet()
- text()
40. You are working with the penguins dataset. You create a scatterplot with the following lines of code:
ggplot(data = penguins) +
geom_point(mapping = aes(x = flipper_length_mm, y = body_mass_g)) +
What code chunk do you add to the third line to save your plot as a pdf file with “penguins” as the file name?
- ggsave(penguins.pdf)
- ggsave(“pdf.penguins”)
- ggsave(=penguins)
- ggsave(“penguins.pdf”)
41. A data analyst creates a plot using the following code chunk:
ggplot(data = penguins) +
geom_point(mapping = aes(x = flipper_length_mm, y = body_mass_g))
Which of the following represents an aesthetic attribute in the code chunk? Select all that apply.
- flipper_length_mm
- body_mass_g
- y
- x
42. What argument of the labs() function can a data analyst use to add text outside of the grid area of a plot?
- text
- note
- title
- annotate
43. In R studio, what default options does the Export functionality of the Plots tab give for exporting plots?
- HTML
- Image
- Slideshow
44. Fill in the blank: In ggplot2, you use the _____ to add layers to your plot.
- The plus sign (+)
- The pipe operator (%>%)
- The equals sign (=)
- The ampersand symbol (&)
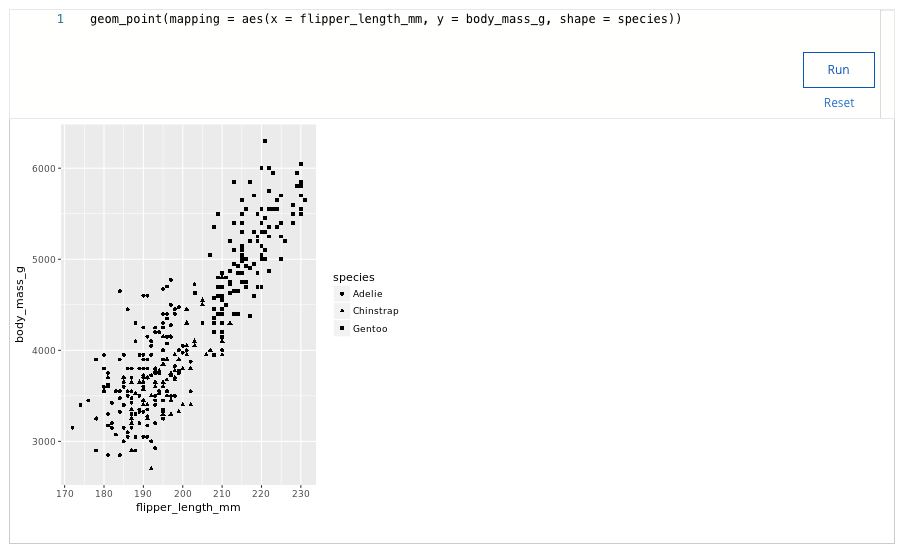
45. A data analyst is working with the penguins data. The analyst creates a scatterplot with the following code:
ggplot(data = penguins) +
geom_point(mapping = aes(x = flipper_length_mm, y = body_mass_g, alpha = species))
What does the alpha aesthetic do to the appearance of the points on the plot?
- Makes the points on the plot larger
- Makes some points on the plot more transparent
- Makes the points on the plot smaller
- Makes the points on the plot more colorful
46. You are working with the diamonds dataset. You create a bar chart with the following code:
ggplot(data = diamonds) +
geom_bar(mapping = aes(x = color, fill = cut)) +
You want to use the facet_wrap() function to display subsets of your data. Add the code chunk that lets you facet your plot based on the variable cut.
How many subplots does your visualization show?
- 3
- 4
- 5
- 6
