
25. Which of the following tasks can you complete with ggplot2 features? Select all that apply.
- Customize the visual features of a plot
- Automatically clean data before creating a plot
- Add labels and annotations to a plot
- Create many different types of plots
26. A data analyst is working with the following plot and gets an error caused by a bug. What is the cause of the bug?
ggplot(data = penguins)
+ geom_point(mapping = aes(x = flipper_length_mm, y = body_mass_g))
- The plus should be at the end of the first line.
- A missing closing parenthesis needs to be added.
- The code uses a plus sign instead of a pipe.
- A function name needs to be capitalized.
27. You are working with the penguins dataset. You create a scatterplot with the following code chunk:
ggplot(data = penguins) +
geom_point(mapping = aes(x = flipper_length_mm, y = body_mass_g))
You want to highlight the different penguin species in your plot. Add a code chunk to the second line of code to map the aesthetic shape to the variable species.
NOTE: the three dots (...) indicate where to add the code chunk. You may need to scroll in order to find the dots.
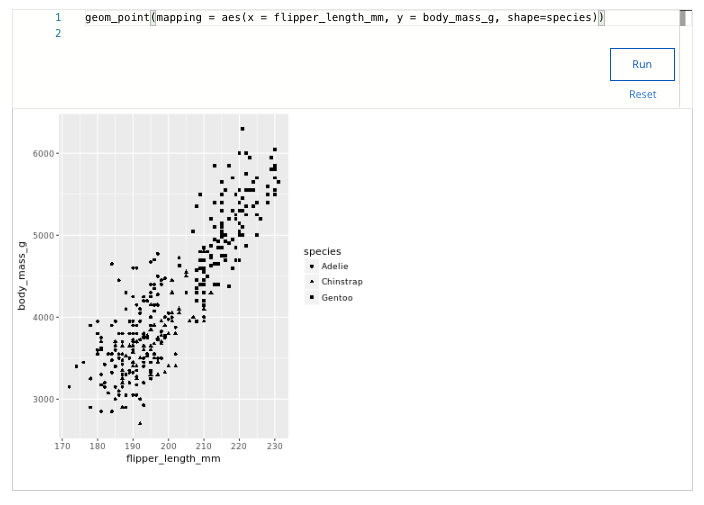
Which species tends to have the longest flipper length and highest body mass?
- Gentoo
- Macaroni
- Adelie
- Chinstrap
28. A data analyst creates a scatterplot where the points are very crowded, which makes it hard to notice when points are stacked. What change can they make to their scatter plot to make it easier to notice the stacked data points?
- Change geom_point() to geom_jitter()
- Change ggplot() to ggplot2()
- Change the color of the points
- Change the shape of the points
29. Which code snippet will make all of the bars in the plot have different colors and shapes based on their heights?
ggplot(data = buildings) +
geom_bar(mapping = aes(x = construction_year, color=[height, height]))
ggplot(data = buildings) +
geom_bar(mapping = aes(x = construction_year, color=height, shape=height))
ggplot(data = buildings) +
geom_bar(mapping = aes(x = construction_year, color=height), aes(shape=height))
ggplot(data = buildings) +
geom_bar(mapping = aes(x = construction_year)) +
color(height) +
shape(height)
30. You are working with the penguins dataset. You create a scatterplot with the following code:
ggplot(data = penguins) +
geom_point(mapping = aes(x = flipper_length_mm, y = body_mass_g))
You want to highlight the different years of data collection on your plot. Add a code chunk to the second line of code to map the aesthetic size to the variable year.
NOTE: the three dots (...) indicate where to add the code chunk. You may need to scroll in order to find the dots.
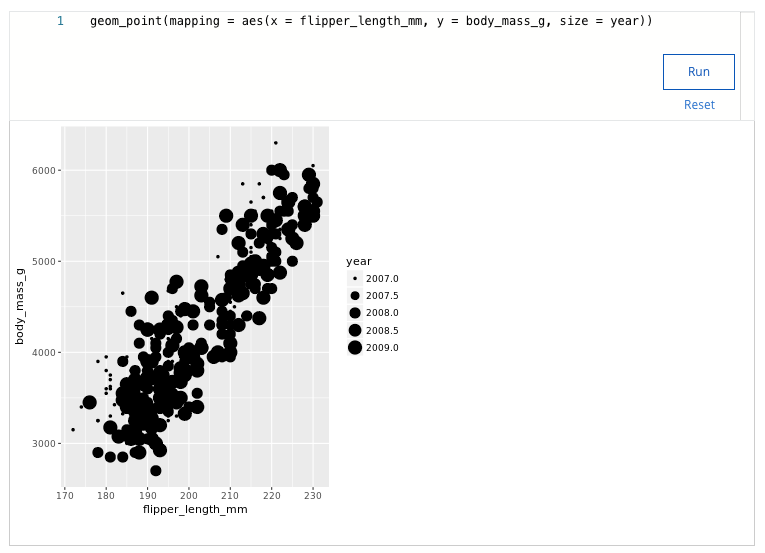
What years does your visualization display?
- 2006-2010
- 2005-2009
- 2007-2009
2007-2011
31. Fill in the blank: The _____ creates a scatterplot and then adds a small amount of random noise to each point in the plot to make the points easier to find.
- geom_jitter() function
- geom_point() function
- geom_bar() function
- geom_smooth() function
32. A data analyst creates a plot using the following code chunk:
ggplot(data = buildings) +
geom_bar(mapping = aes(x = construction_year, color = height))
Which of the following represents a function in the code chunk?
- The height function
- The x function
- The ggplot function
- The mapping function
33. A data analyst is working with the following plot and gets an error caused by a bug. What is the cause of the bug?
ggplot(data = penguins) +
geom_point(mapping = aes(x = flipper_length_mm, y = body_mass_g)
- A missing closing parenthesis needs to be added.
- The plus sign should be at the beginning of the second line.
- The code uses a plus sign instead of a pipe.
- A function name needs to be capitalized.
34. Which of the following statements best describes a facet in ggplot?
- Facets are the ggplot terminology for a chart axis.
- Facets are subplots that display data for each value of a variable.
- Facets are the visual characteristics of geometry objects.
- Facets are the text used in and around plots.
Shuffle Q/A 3
35. Which of the following is a functionality of ggplot2?
- Combine data manipulation and visualizations using pipes.
- Filter and sort data in complex ways.
- Define complex visualization using a single function.
- Create plots using artificial intelligence.
36. Which ggplot function is used to define the mappings of variables to visual representations of data?
- annotate()
- mapping()
- aes()
- ggplot()
