
13. Which code snippet will make all of the bars in the plot have different colors based on their heights?
ggplot(data = buildings) +
geom_bar(mapping = aes(x = construction_year), color=height)
ggplot(data = buildings) +
geom_bar(mapping = aes(x = construction_year)) +
color(“height”)
ggplot(data = buildings) +
geom_bar(mapping = aes(x = construction_year, color=height))
ggplot(data = buildings) +
geom_bar(mapping = aes(x = construction_year)) +
color(height)
14. What is the purpose of the facet_wrap() function?
- Modify the visual characteristic of a data point
- Modify ggplot visuals to be three-dimensional
- Create text inside a plot area
- Create subplots in a grid of two variables
15. A data analyst uses the annotate() function to create a text label for a plot. Which attributes of the text can the analyst change by adding code to the argument of the annotate() function? Select all that apply.
- Change the font style of the text.
- Change the color of the text.
- Change the size of the text.
- Change the text into a title for the plot.
16. Which statement about the ggsave() function is correct?
- ggsave() exports the last plot displayed by default.
- ggsave() is run from the Plots Tab in RStudio.
- ggsave() is the only way to export a plot.
- ggsave() is unable to save .png files.
17. Which of the following statements about ggplot is true?
- ggplot allows analysts to create plots using a single function.
- ggplot is the default plotting package in base R.
- ggplot allows analysts to create different types of plots.
- ggplot is designed to make cleaning data easy.
18. A data analyst creates a plot using the following code chunk:
ggplot(data = buildings) +
geom_bar(mapping = aes(x = construction_year, color = height))
Which of the following represents a variable in the code chunk?
- construction_year
- mapping
- data
- ggplot
19. Which code snippet will make all of the bars in the plot purple?
ggplot(data = buildings) +
geom_bar(mapping = aes(x = construction_year, color=”purple”))
ggplot(data = buildings) +
geom_bar(mapping = aes(x = construction_year)) +
color(“purple”)
ggplot(data = buildings) +
geom_bar(mapping = aes(x = construction_year, color=height))
ggplot(data = buildings) +
geom_bar(mapping = aes(x = construction_year), color=”purple”)
20. A data analyst is working with the following plot and gets an error caused by a bug. What is the cause of the bug?
ggplot(data = penguins) %>%
geom_point(mapping = aes(x = flipper_length_mm, y = body_mass_g))
- The code uses a pipe instead of a plus sign.
- A missing closing parenthesis needs to be added.
- The pipe should be at the beginning of the second line.
- A function name needs to be capitalized.
21. You are working with the penguins dataset. You create a scatterplot with the following code chunk:
ggplot(data = penguins) +
geom_point(mapping = aes(x = flipper_length_mm, y = body_mass_g))
You want to highlight the different penguin species in your plot. Add a code chunk to the second line of code to map the aesthetic size to the variable bill_depth_mm.
NOTE: the three dots (...) indicate where to add the code chunk. You may need to scroll in order to find the dots.
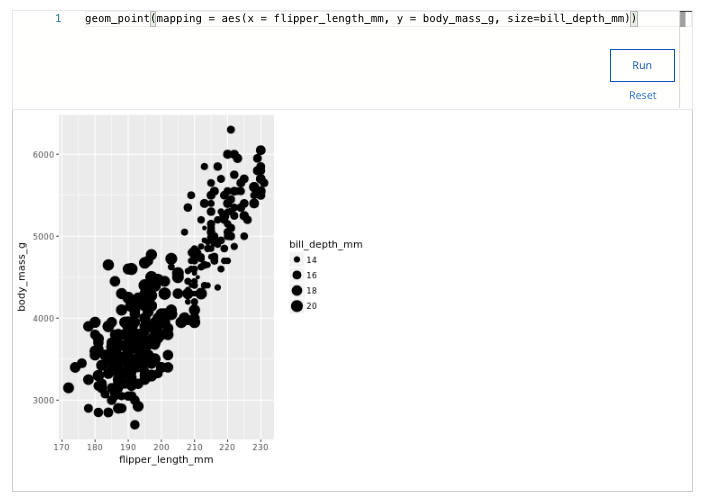
Which approximate range of bill depths does your visualization display?
- 2 – 9
- 31 – 40
- 20 – 31
- 14 – 20
22. A data analyst has a scatter plot with crowded points that make it hard to identify a trend. What geometry function can they add to their plot to clearly indicate the trend of the data?
- geom_alpha()
- geom_bar()
- geom_jitter()
- geom_smooth()
Shuffle Q/A 2
23. A data analyst wants to add a large piece of text above the grid area that clearly defines the purpose of a plot. Which ggplot function can they use to achieve this?
- subtitle()
- title()
- labs()
- annotate()
24. By default, what plot does the ggsave() function export?
- The plot define the plots.config file
- The last displayed plot
- The plot defined in the Plots Tab of R Studio
- The first plot displayed
