
21. You are working with a database table that contains invoice data. The customer_id column lists the ID number for each customer. You are interested in invoice data for the customer with ID number 28.
You write the SQL query below. Add a WHERE clause that will return only data about the customer with ID number 28.
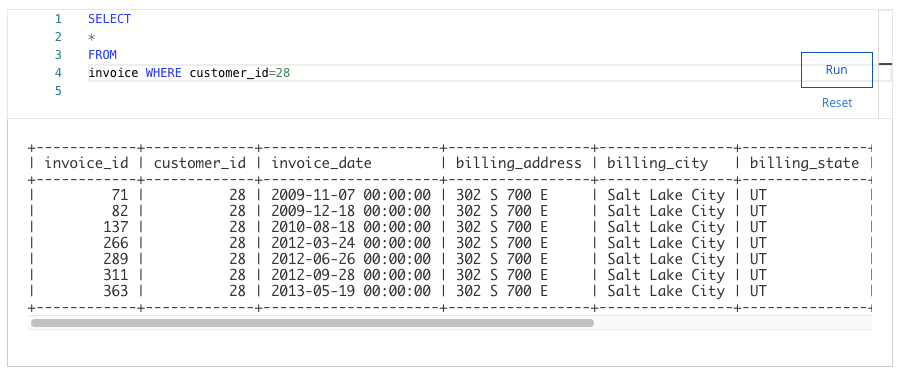
After you run your query, use the slider to view all the data presented.
What is the billing city for the customer with ID number 28?
- Bangalore
- Buenos Aires
- Dijon
- Salt Lake City
22. Which of the following best describes a bar chart?
- It is a visualization that uses a circle which is divided into wedges sized based on numerical proportion.
- It is a visualization that plots a sequence of points and connects them with them with straight lines or curves.
- It is a visualization that represents data with columns, or bars, the heights of which are proportional to the values that they represent.
- It is a visualization that plots individual points in the Cartesian coordinate plane.
23. A data analyst has to create a visualization that clearly shows when and for how long the population of Charlotte has been above one million people. They choose to use a line chart. Why is this the best choice for their visualization?
- It is a visualization that plots a sequence of points and connects them with straight lines or curves.
- It is a visualization that uses a circle which is divided into wedges sized based on numerical proportion.
- It is a visualization that represents data with columns, or bars, the heights of which are proportional to the values that they represent.
- It is a visualization that plots individual points in the Cartesian coordinate plane.
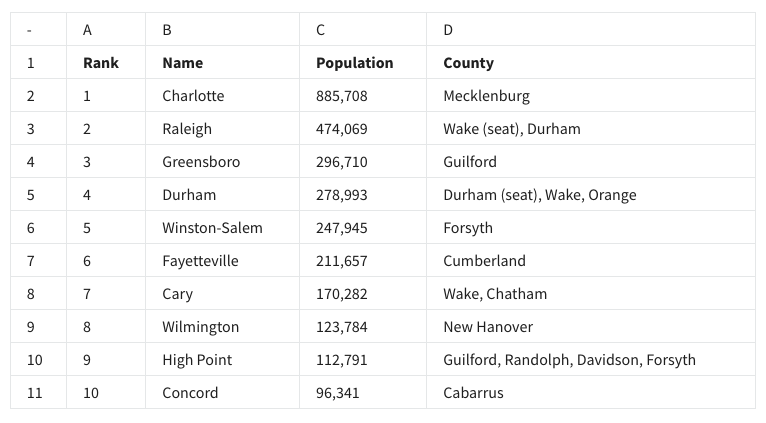
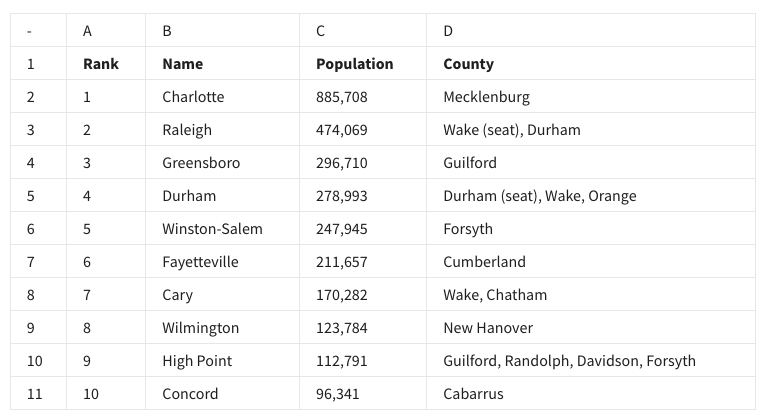
24. The words rank, name, population, and county in row 1 of the following spreadsheet are known as descriptors.
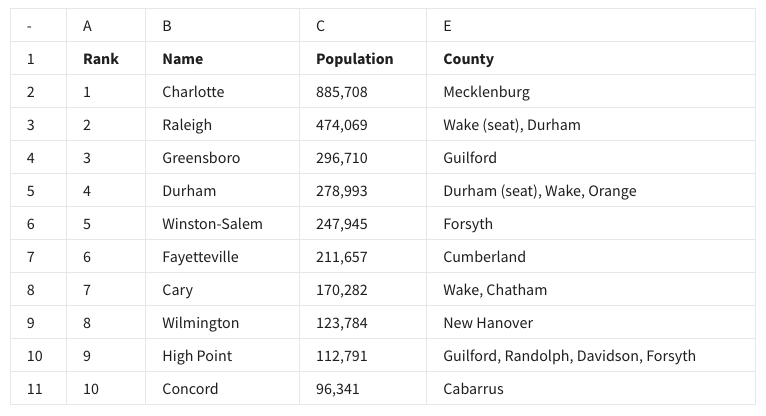
- True
- False
25. Fill in the blank: In the following spreadsheet, the ________ of High Point describes all of the data in row 10.
- criteria
- dataset
- observation
- format
26. If a data analyst wants to list the cities in this spreadsheet alphabetically, instead of numerically, what feature can they use in column B?
- Sort range
- Name range
- Randomize range
- Organize range
27. A data analyst wants to create a visualization that depicts the populations of the top ten most populous cities in North Carolina. What type of chart would be best for this?
- A pie chart
- A scatter chart
- A column, or bar, chart
- A line chart
28. A data analyst has to demonstrate a trend of how something has changed over time. What type of chart is best for this task?
- Line
- Area
- Bar
- Column
Shuffle Q/A 3
29. You are working with a database table that contains invoice data. The customer_id column lists the ID number for each customer. You are interested in invoice data for the customer with ID number 54.
You write the SQL query below. Add a WHERE clause that will return only data about the customer with ID number 54.
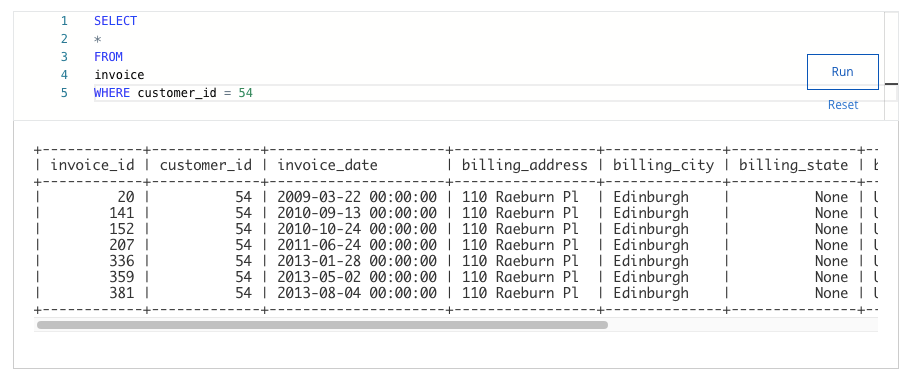
After you run your query, use the slider to view all the data presented.
What is the billing address for the customer with ID number 54?
- 1033 N Park Ave
- 230 Elgin St
- 110 Raeburn Pl
- 801 W 4th St
30. Fill in the blank: A data analyst creates a table, but they realize this isn’t the best visualization for their data. To fix the problem, they decide to use the ____ feature to change it to a column chart.
- chart editor
- rename
- filter view
- image
