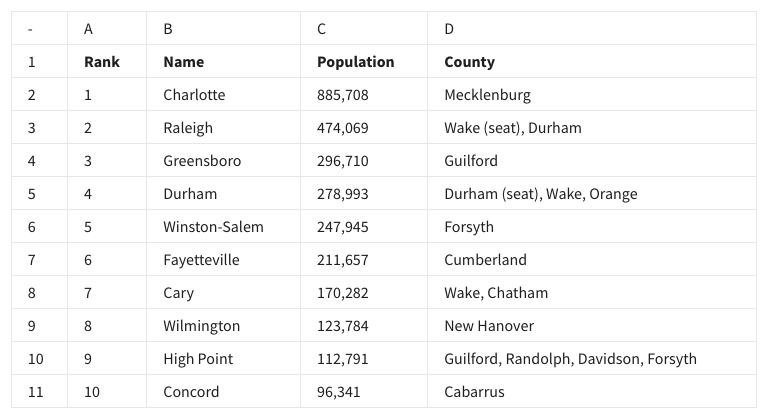
32. Fill in the blank: Suppose you wanted to determine the average population of the cities in the following spreadsheet. The correct function syntax to use would be ________ .
33. A data analyst wants to list the cities in this spreadsheet alphabetically, instead of numerically. They can use the feature sort range to do this.
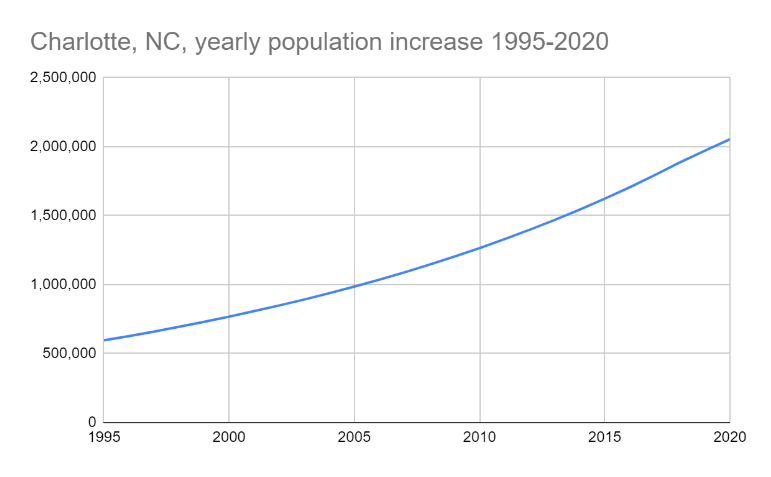
35. A company is curious about the population trend in Charlotte, NC. A data analyst in the company is tasked with creating a visualization that depicts such information. What type of chart would be best for this task and why?
A pie chart because it plots a sequence of points and connects them with straight lines or curves.
A line chart because it plots a sequence of points and connects them with straight lines or curves.
A line chart because it is a visualization that uses a circle which is divided into wedges sized based on numerical proportion.
A bar chart because it is a visualization that represents data with columns, or bars, the heights of which are proportional to the values that they represent.
36. To find the average population of the cities in this spreadsheet, what is the correct AVERAGE function syntax? Type your answer below.
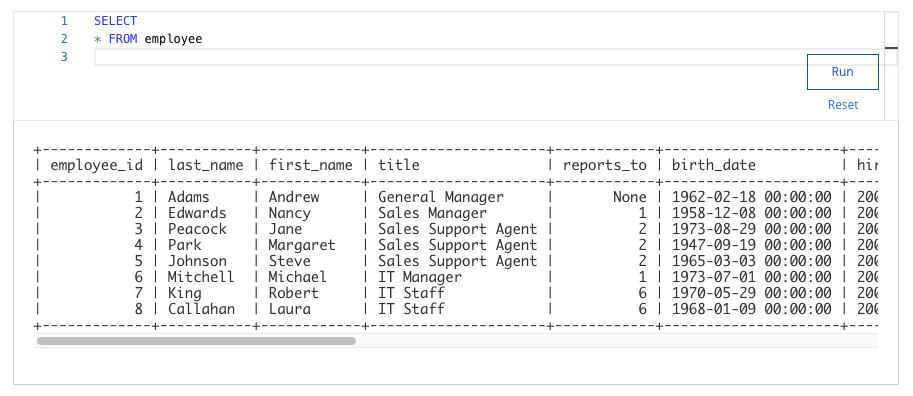
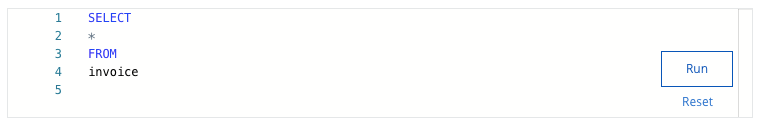
37. You are working with a database table that contains invoice data. The customer_id column lists the ID number for each customer. You are interested in invoice data for the customer with ID number 50.
You write the SQL query below. Add a WHERE clause that will return only data about the customer with ID number 50.
After you run your query, use the slider to view all the data presented.
What is the billing city for the customer with ID number 50?
38. Fill in the blank: A data analyst has to demonstrate how the population in a city has increased over time. In particular, they want to be able to see when the population has exceeded certain thresholds. The chart that would work best for this is a/an _____ chart.
40. A data analyst has to demonstrate how the population in Charlotte has increased over time. They create the chart below. What is this type of chart called?