
16. Scenario 1, continued
Now that you’ve created a data frame, you want to find out more about how the data is organized. The data frame has hundreds of rows and lots of columns.
Assume the name of your data frame is flavors_df. What code chunk lets you review the structure of the data frame?
- filter(flavors_df)
- str(flavors_df)
- select(flavors_df)
- summarize(flavors_df)
17. Scenario 1, continued
Next, you begin to clean your data. When you check out the column headings in your data frame you notice that the first column is named Company...Maker.if.known. (Note: The period after known is part of the variable name.) For the sake of clarity and consistency, you decide to rename this column Brand (without a period at the end).
Assume the first part of your code chunk is:
flavors_df %>%
What code chunk do you add to change the column name?
- rename(Brand = Company…Maker.if.known.)
- rename(Company…Maker.if.known. = Brand)
- rename(Company…Maker.if.known. , Brand)
- rename(Brand, Company…Maker.if.known.)
18. After previewing and cleaning your data, you determine what variables are most relevant to your analysis. Your main focus is on Rating, Cocoa.Percent, and Company.Location. You decide to use the select() function to create a new data frame with only these three variables.
Assume the first part of your code is:
trimmed_flavors_df <- flavors_df %>%
Add the code chunk that lets you select the three variables.

What company location appears in row 1 of your tibble?
- Scotland
- Canada
- Colombia
- France
19. After completing your analysis of the rating system, you determine that any rating greater than or equal to 3.75 points can be considered a high rating. You also know that Chocolate and Tea considers a bar to be super dark chocolate if the bar's cocoa percentage is greater than or equal to 80%. You decide to create a new data frame to find out which chocolate bars meet these two conditions.
Assume the first part of your code is:
best_trimmed_flavors_df <- trimmed_flavors_df %>%
You want to apply the filter() function to the variables Cocoa.Percent and Rating. Add the code chunk that lets you filter the new data frame for chocolate bars that contain at least 80% cocoa and have a rating of at least 3.75 points.
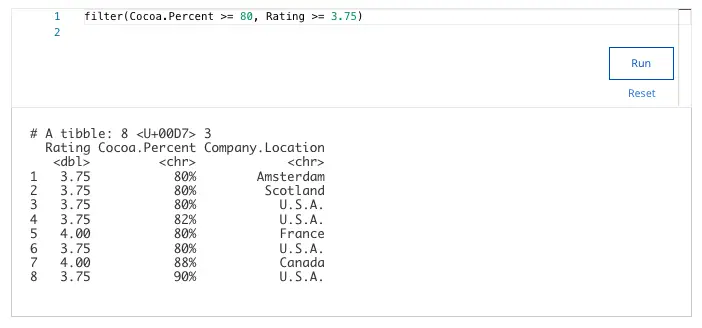
How many rows does your tibble include?
- 22
- 20
- 12
- 8
20. Scenario 2, continued
A teammate creates a new plot based on the chocolate bar data. The teammate asks you to make some revisions to their code.
Assume your teammate shares the following code chunk:
ggplot(data = best_trimmed_flavors_df) +
geom_bar(mapping = aes(x = Company)) +
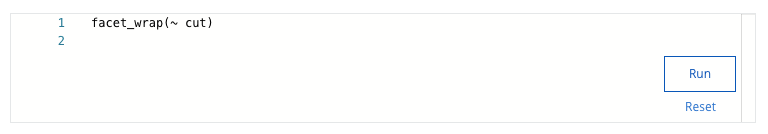
What code chunk do you add to the third line to create wrap around facets of the variable Company?
- facet(Company)
- facet_wrap(+Company)
- facet_wrap(~Company)
- facet_wrap(=Company)
21. Scenario 2, continued
Your team has created some basic visualizations to explore different aspects of the chocolate bar data. You’ve volunteered to add titles to the plots. You begin with a scatterplot.
Assume the first part of your code chunk is:
ggplot(data = trimmed_flavors_df) +
geom_point(mapping = aes(x = Cocoa.Percent, y = Rating)) +
What code chunk do you add to the third line to add the title Suggested Chocolate to your plot?
- labs(title = “Suggested Chocolate”)
- labs(Suggested Chocolate = title)
- labs(Suggested Chocolate)
- labs <- “Suggested Chocolate”
22. Scenario 2, continued
Next, you create a new scatterplot to explore the relationship between different variables. You want to save your plot so you can access it later on. You know that the ggsave() function defaults to saving the last plot that you displayed in RStudio, so you’re ready to write the code to save your scatterplot.
Assume your first two lines of code are:
ggplot(data = trimmed_flavors_df) +
geom_point(mapping = aes(x = Cocoa.Percent, y = Rating)) +
What code chunk do you add to the third line to save your plot as a pdf file with “chocolate” as the file name?
- ggsave(“chocolate.png”)
- ggsave(“chocolate.pdf”)
- ggsave(“pdf.chocolate”)
- ggsave(chocolate.pdf)
23. Scenario 2, continued
As a final step in the analysis process, you create a report to document and share your work. Before you share your work with the management team at Chocolate and Tea, you are going to meet with your team and get feedback. Your team wants the documentation to include all your code and display all your visualizations.
Fill in the blank: You want to record and share every step of your analysis, let teammates run your code, and display your visualizations. You decide to create _____ to document your work.
- a database
- a spreadsheet
- an R Markdown notebook
- a data frame
24. Scenario 1, continued
Before you begin working with your data, you need to import it and save it as a data frame. To get started, you open your RStudio workspace and load the tidyverse library. You upload a .csv file containing the data to RStudio and store it in a project folder named flavors_of_cacao.csv.
You use the read_csv() function to import the data from the .csv file. Assume that the name of the data frame is chocolate_df and the .csv file is in the working directory. What code chunk lets you create the data frame?
- read_csv(“flavors_of_cacao.csv”) + chocolate_df
- chocolate_df <- “flavors_of_cacao.csv”(read_csv)
- chocolate_df <-read_csv(“flavors_of_cacao.csv”)
- chocolate_df + read_csv(“flavors_of_cacao.csv”)
25. Scenario 1, continued
Next, you begin to clean your data. When you check out the column headings in your data frame you notice that the first column is named Company...Maker.if.known. (Note: The period after known is part of the variable name.) For the sake of clarity and consistency, you decide to rename this column Company (without a period at the end).
Assume the first part of your code chunk is:
flavors_df %>%
What code chunk do you add to change the column name?
- rename(Company = Company…Maker.if.known.)
- rename(Company…Maker.if.known. <- Company)
- rename(Company…Maker.if.known. = Company)
- rename(Company <- Company…Maker.if.known.)
26. Scenario 2, continued
As a final step in the analysis process, you create a report to document and share your work. Before you share your work with the management team at Chocolate and Tea, you are going to meet with your team and get feedback. Your team wants the documentation to include all your code and display all your visualizations.
You want to record and share every step of your analysis, let teammates run your code, and display your visualizations. What do you use to document your work?
- A database
- A spreadsheet
- A data frame
- An R Markdown notebook
27. Next, you select the basic statistics that can help your team better understand the ratings system in your data.
Assume the first part of your code is:
trimmed_flavors_df %>%
You want to use the summarize() and mean() functions to find the mean rating for your data. Add the code chunk that lets you find the mean value for the variable Rating.
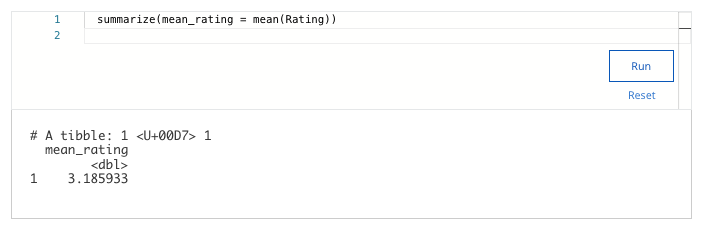
What is the mean rating?
- 3.995445
- 3.185933
- 4.701337
- 4.230765
28. Now that you’ve cleaned and organized your data, you’re ready to create some useful data visualizations. Your team assigns you the task of creating a series of visualizations based on requests from the Chocolate and Tea management team. You decide to use ggplot2 to create your visuals.
Assume your first line of code is:
ggplot(data = best_trimmed_flavors_df) +
You want to use the geom_bar() function to create a bar chart. Add the code chunk that lets you create a bar chart with the variable Company on the x-axis.
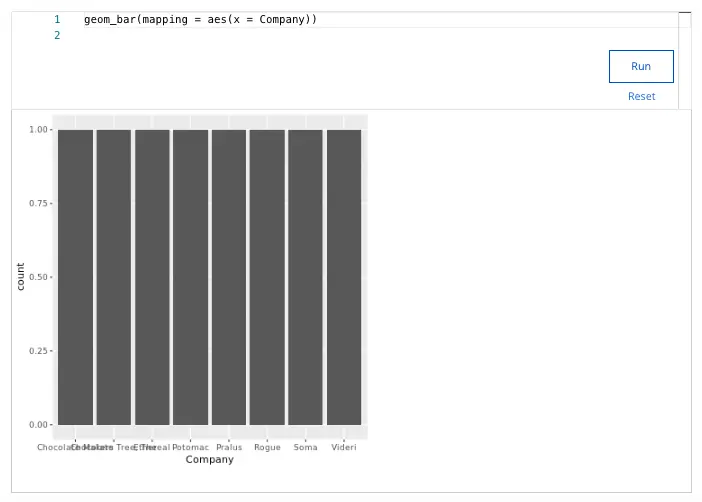
How many bars does your bar chart display?
- 6
- 4
- 8
- 10
Shuffle Q/A 2
29. Next, you select the basic statistics that can help your team better understand the ratings system in your data.
Assume the first part of your code is:
trimmed_flavors_df %>%
You want to use the summarize() and sd() functions to find the standard deviation of the rating for your data. Add the code chunk that lets you find the standard deviation for the variable Rating.
What is the standard deviation of the rating?
- 0.4458434
- 0.4780624
- 0.2951794
- 0.3720475
30. Now that you’ve cleaned and organized your data, you’re ready to create some useful data visualizations. Your team assigns you the task of creating a series of visualizations based on requests from the Chocolate and Tea management team. You decide to use ggplot2 to create your visuals.
Assume your first line of code is:
ggplot(data = best_trimmed_flavors_df) +
You want to use the geom_bar() function to create a bar chart. Add the code chunk that lets you create a bar chart with the variable Rating on the x-axis.
What is the standard deviation of the rating?
- 5
- 2
- 3
- 6
